2022 E-Insights Report
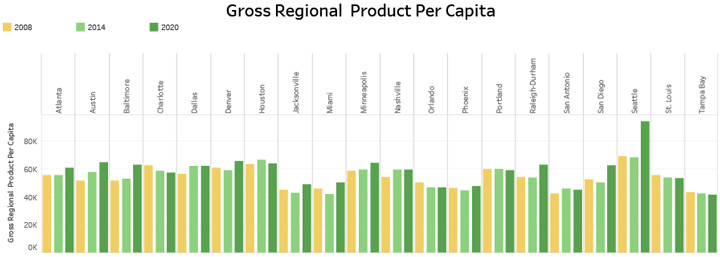
Gross Regional Product Per Capita
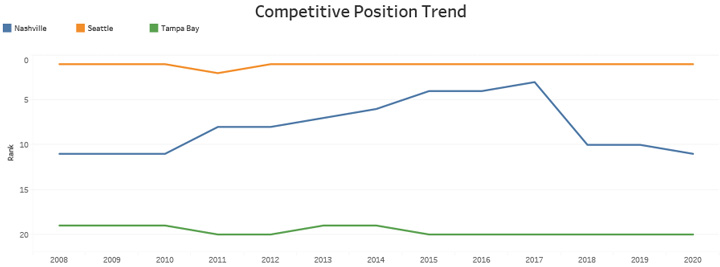
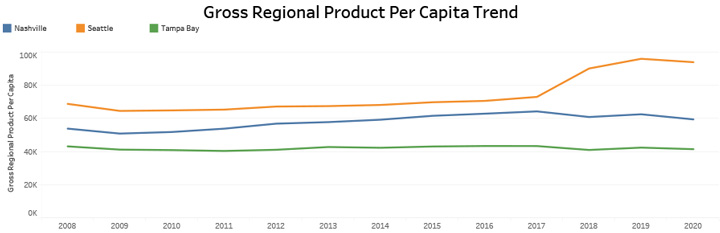
- The Tampa Bay MSA has consistently been in last place most of the years.
- Seattle has consistently been ranked No. 1 among all the comparison MSAs in terms of GRP Per capita since 2012.
- Florida MSAs rank relatively low among the comparison group.
About: This measurement divides the Gross Regional Product, the value of all goods and services
produced in the region, by the population of the region.
Source: U.S Bureau of Economic Analysis, Regional Data, Per Capita Real GDP.
Gross Regional Product Per Capita
Gross Regional Product Per Capita Trend
Competitive Position Trend