College of Engineering News Room
Using Visualization to Gauge Uncertainty
By Brad Stager
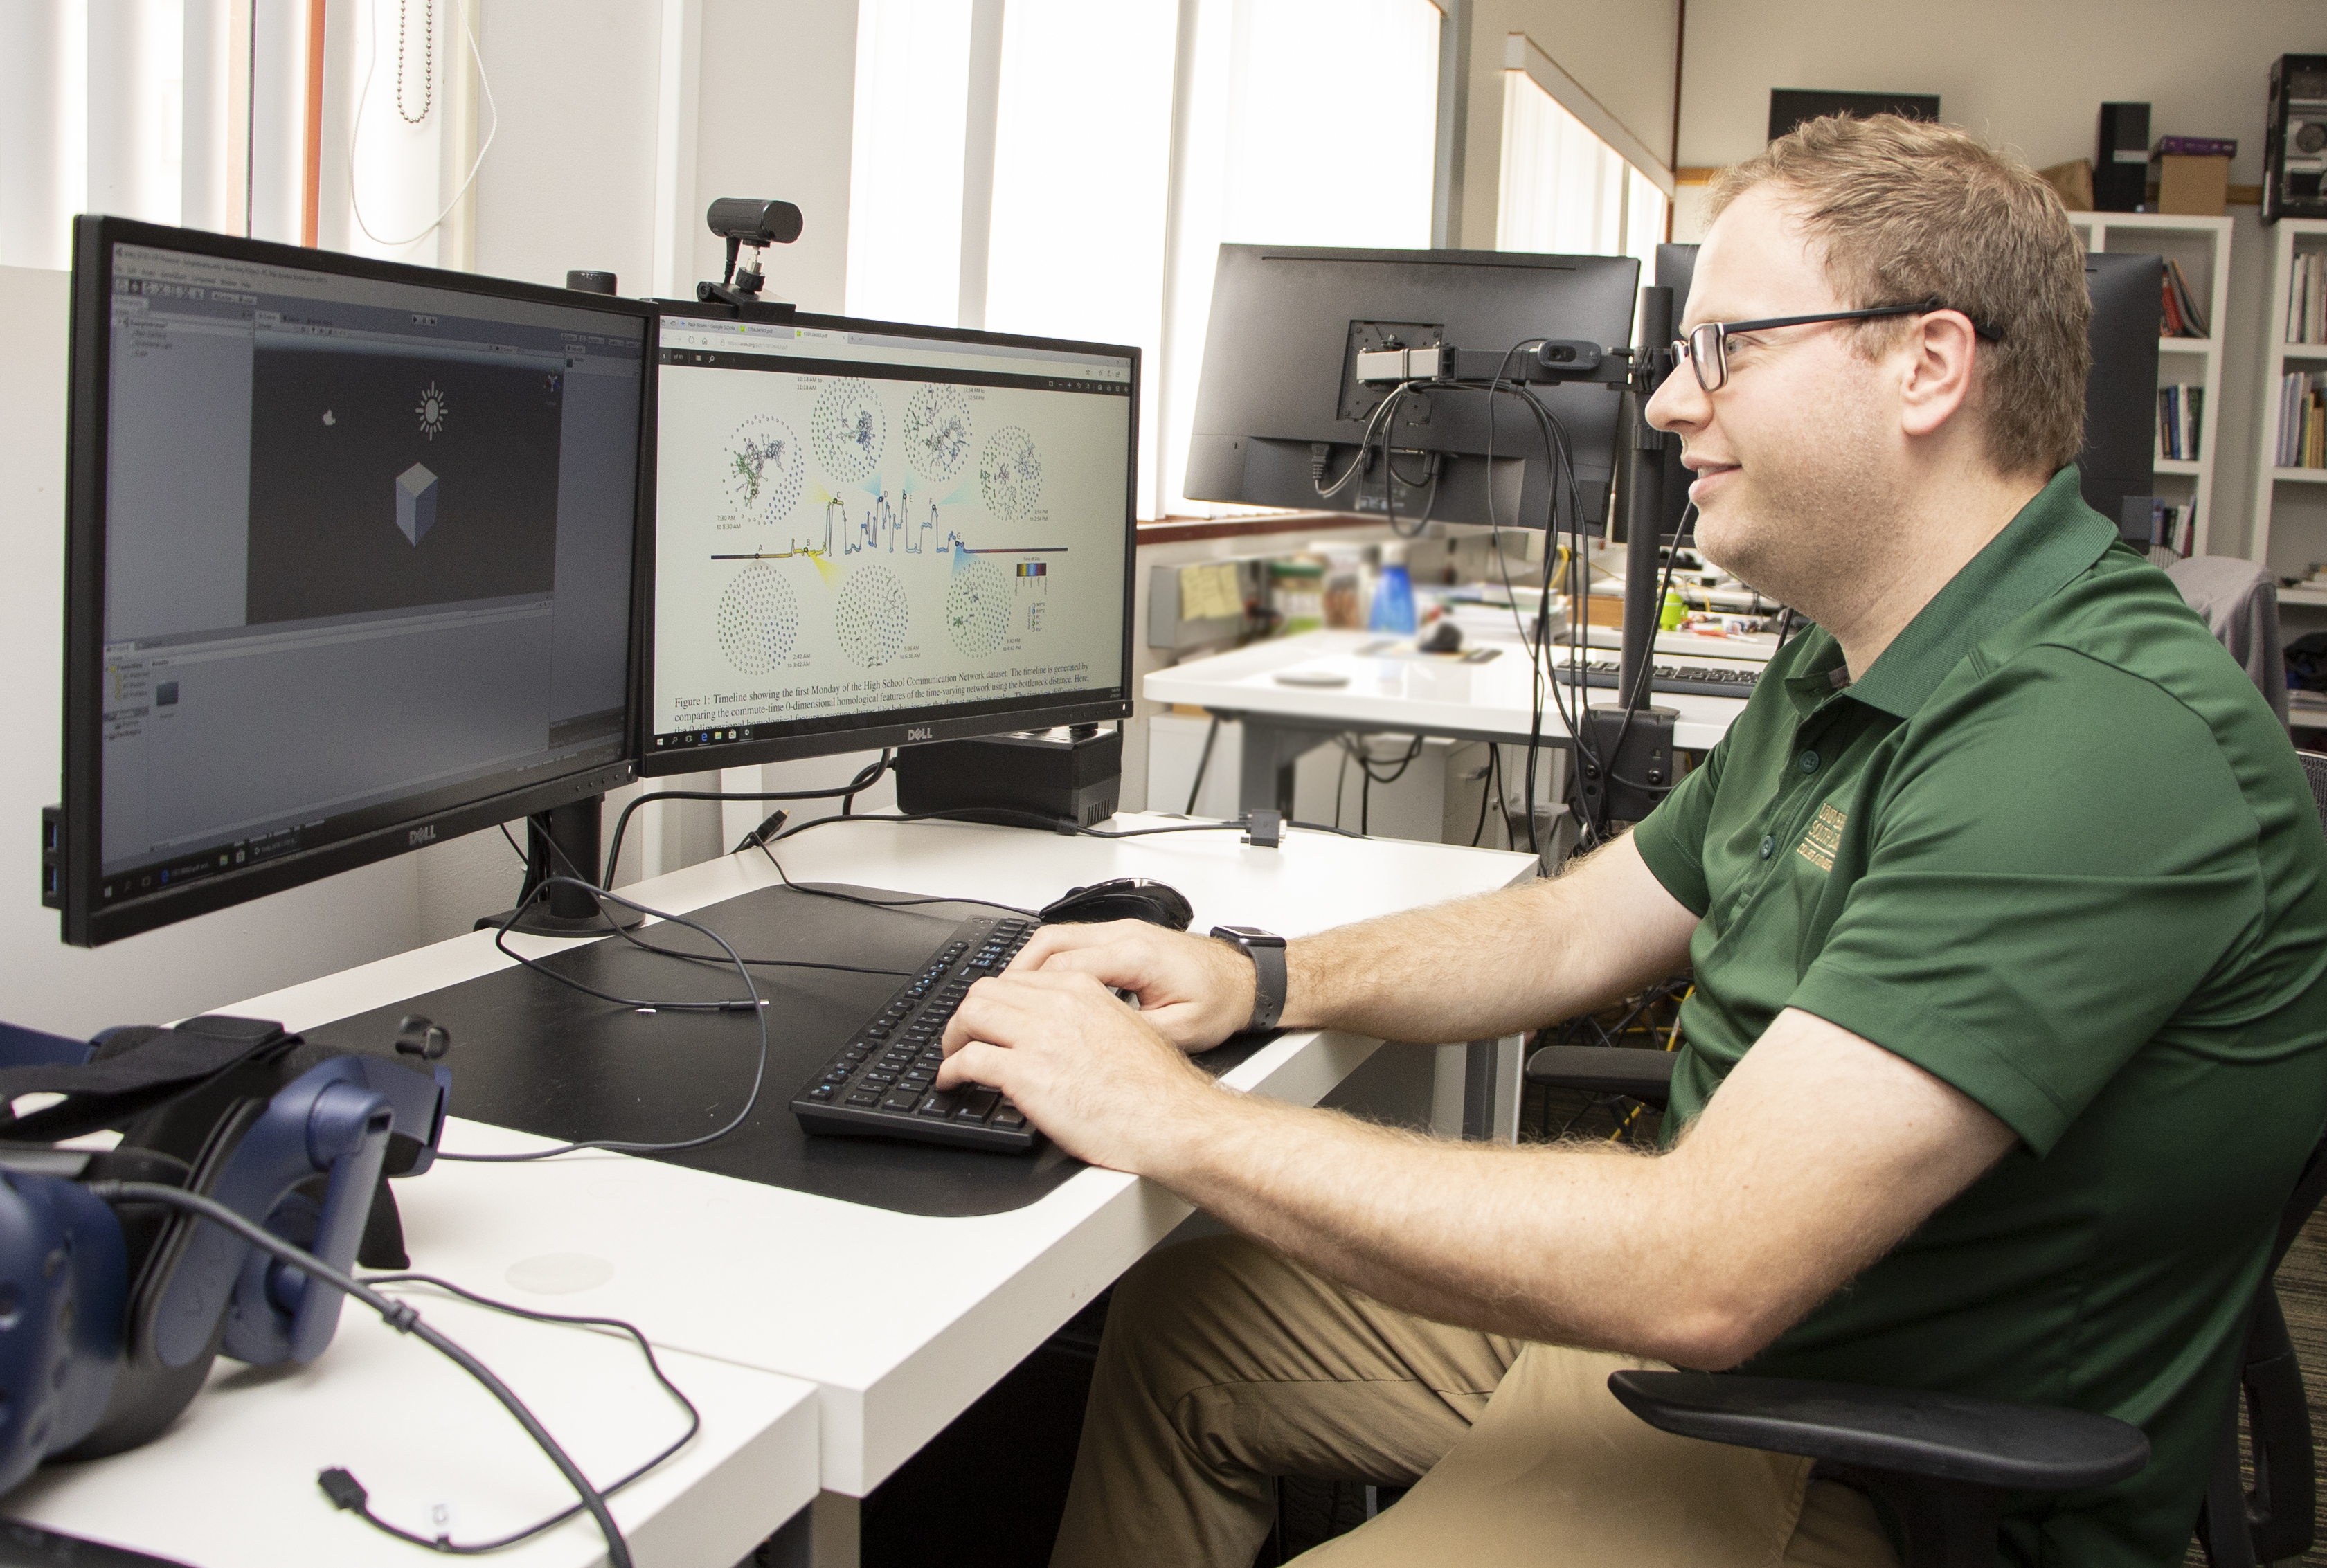
Paul Rosen, Ph.D., has been a USF Computer Science and Engineering faculty member since 2015.
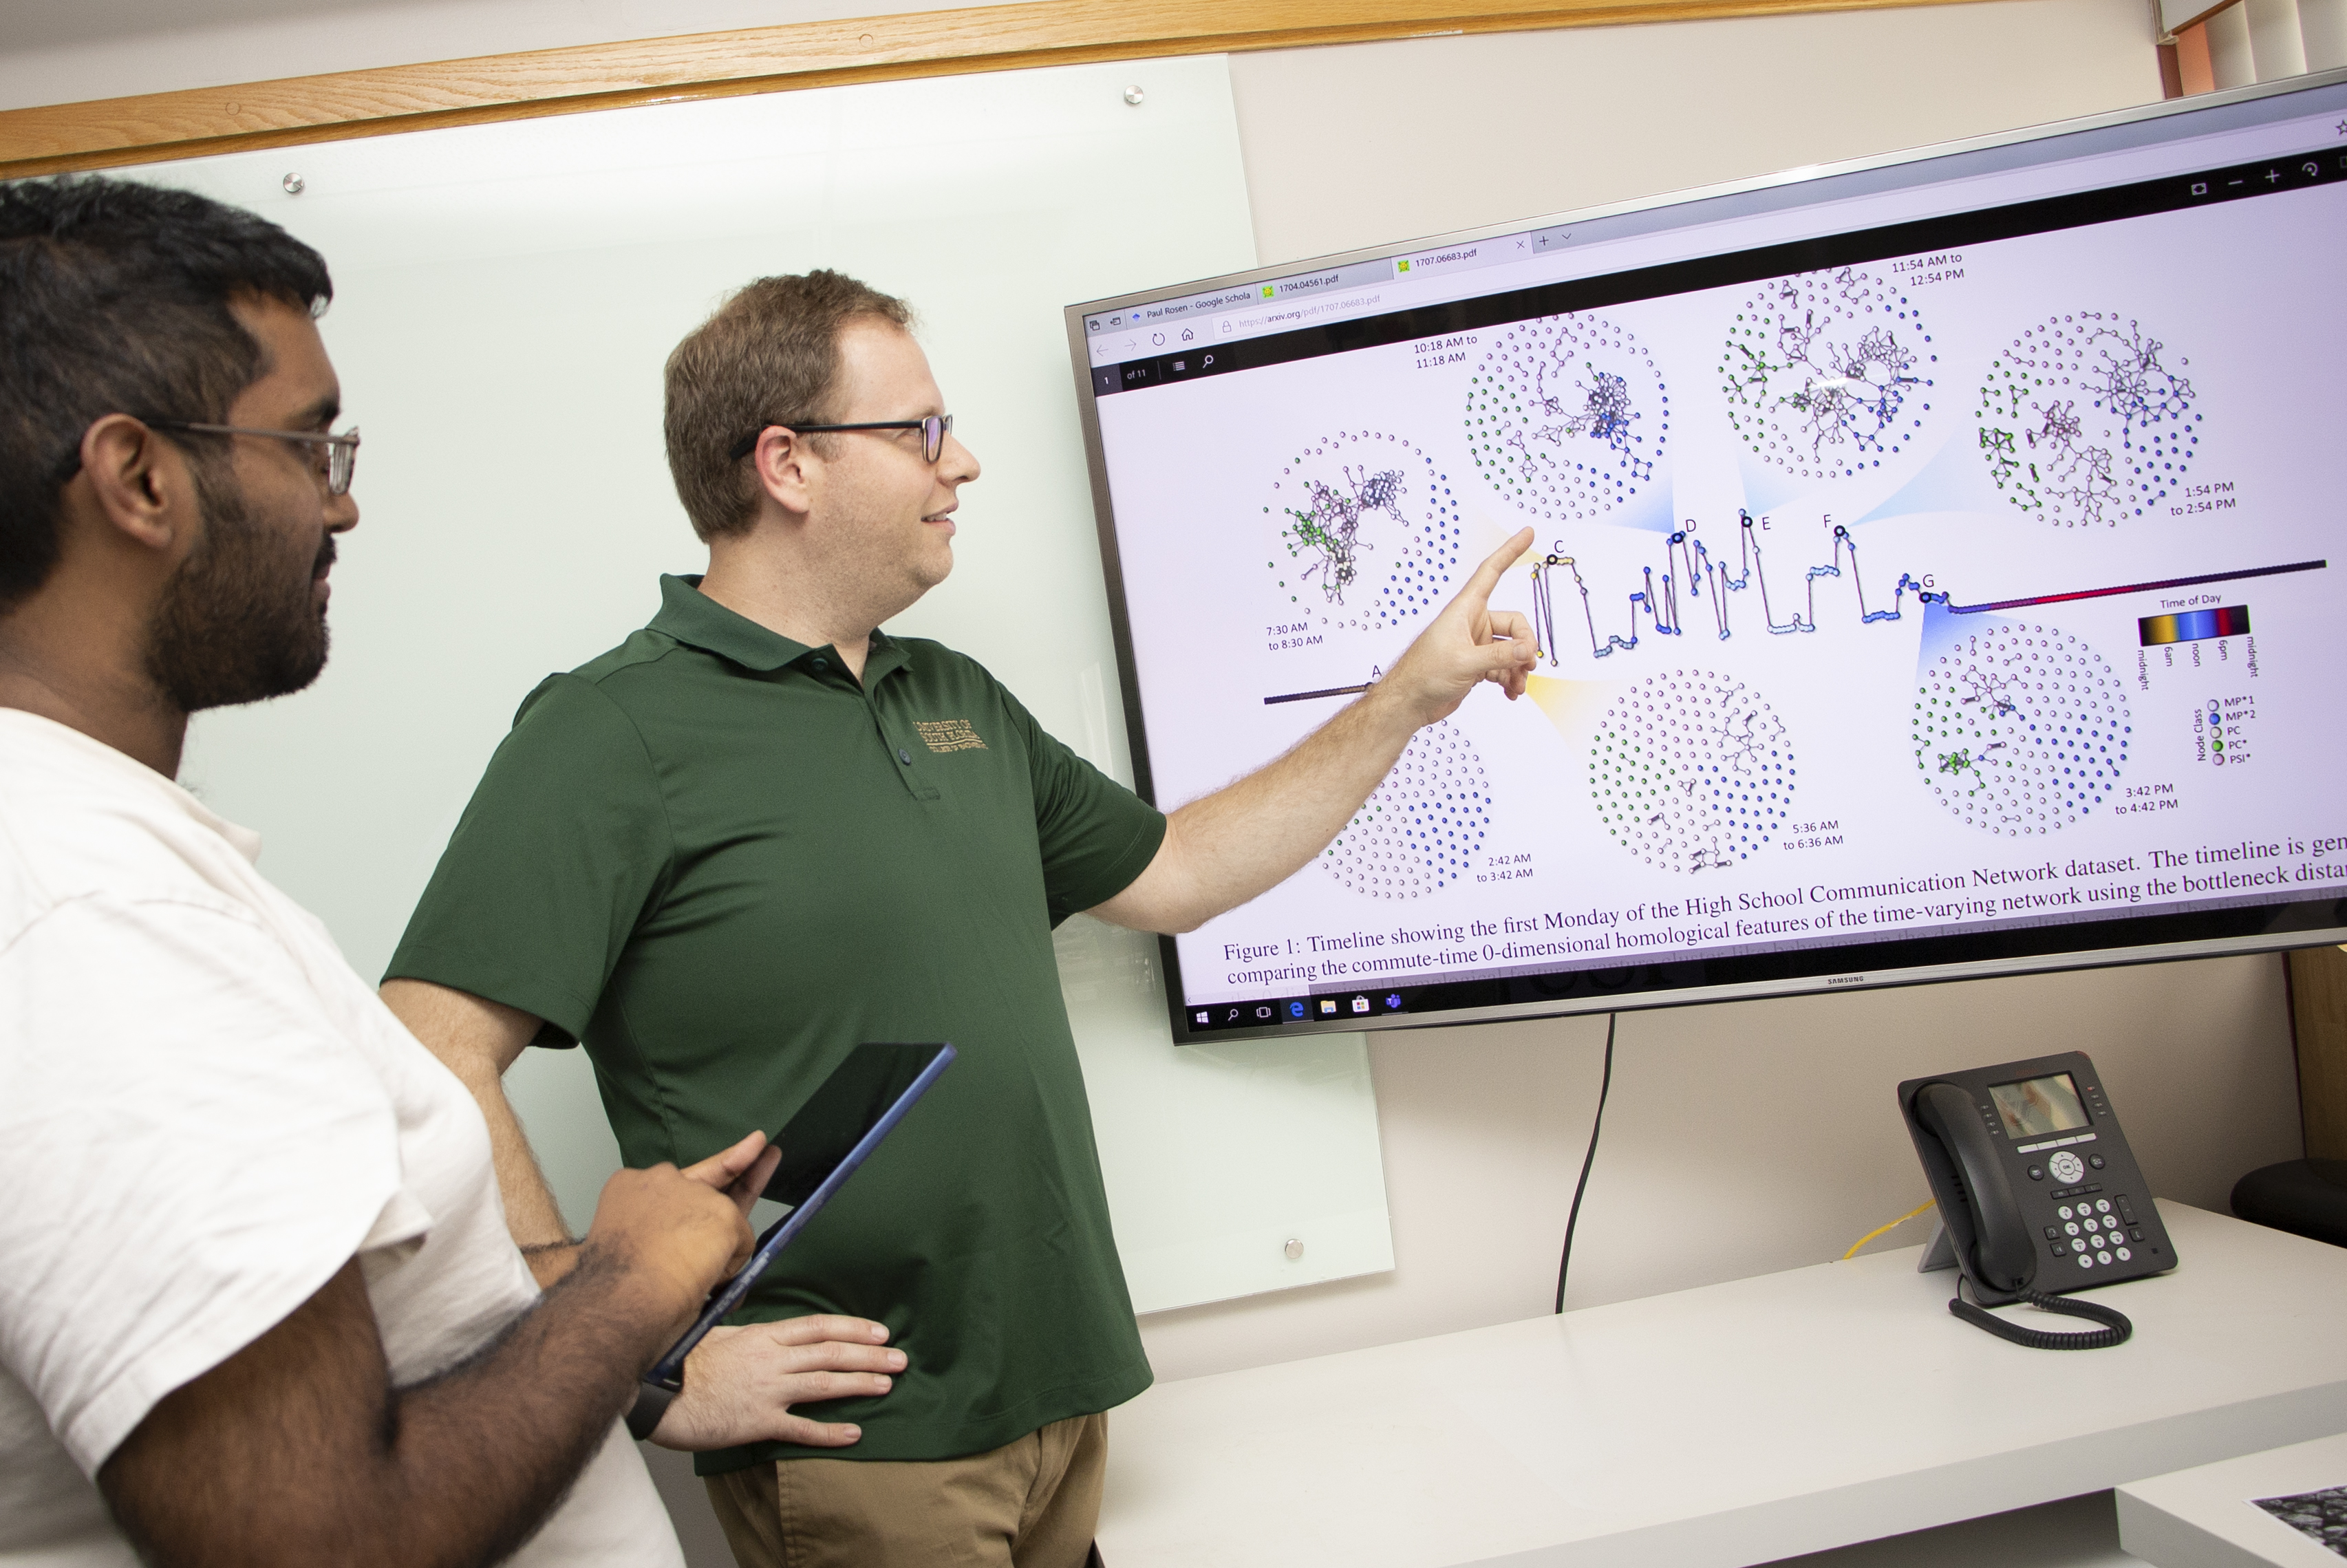
Visualization is a topic of considerable interest in the Department of Computer Science and Engineering, and faculty research in those areas got a boost in the form of a National Science Foundation CAREER award granted to department professor Paul Rosen, Ph.D.
Awarded under the title, “Discovering Structure in Uncertainty: Using Topology for Interactive Visualization of Uncertainty,” the funding allows Rosen to build on his work of developing mathematical tools that optimize data, resulting in improved digital descriptions of materials and their associated behaviors.
Using topology to visualize data can improve understanding of the uncertainty inherent in a simulation or model. Rosen said this can potentially lead to better decisions in settings ranging from industrial manufacturing sites to surgical operating rooms. He provided an explanation of what topology is.
“One simple example of topology is counting the number of holes in objects,” said Rosen. “The classic example is a coffee mug, as the object actually only has one hole in it. From a topology standpoint, the handle is the only hole.”
Rosen added that a basic concept of topology is that a donut and a coffee cup are, topologically speaking, the same since each has only one hole. Topology is commonly used to analyze changes in materials as they morph into different shapes without tearing or breaking.
Collaborating with Rosen — the principal investigator on the NSF continuing grant — are Kristen Potter, a visualization scientist at the National Renewable Energy Laboratory in Denver, Colorado, and Chris Johnson, director of the Scientific Computing and Imaging Institute at the University of Utah. They will work with Rosen to support applicable research in the areas of energy and bioengineering, respectively. The award is for a total of $449,520 and funds Rosen’s research for five years.
According to Rosen, who has received NSF funding since 2014, developing better decision-making tools is an important endeavor that can provide benefits in many areas. One bioengineering application, for example, is the potential to change how tissue damage after a heart attack is diagnosed. Instead of physically opening a person’s chest to inspect their heart, sensors capable of building a model of the damage would be much less invasive.
“The most important thing here is making sure people have the right information so they can make the best possible decisions,” he said. “There’s always going to be some uncertainty when you make decisions, but you want people to be able to have confidence in their decisions.”
Rosen’s current work focuses on using data visualization to help improve the decision-making processes of experimental situations and natural events.
Rosen became College of Engineering faculty in 2015 and earned his Ph.D. in Computer Science from Purdue University. While at Purdue, Rosen was part of a team that used numerical data simulations to create an animated video illustrating the physics of a passenger airliner’s collision with the World Trade Center’s north tower during the September 11 attacks.
Created to provide scientifically accurate, visual context to the attacks and help improve future buildings, the video is available on Purdue’s YouTube channel and has been viewed more than four million times. According to Rosen, selecting and applying data to the model required careful consideration.
“The problem was full of uncertainty. Experts in civil engineering and aviation picked numbers that they thought were reasonable for the properties of the steel, the properties of the fuel, the weight of the fuel and how much fuel was in the aircraft,” Rosen said. “Since we didn’t have precise information, we picked ranges of numbers that were reasonable and ran lots of simulations.”
Rosen’s current work focuses on improving decision-making processes by using topological data analysis to visualize uncertainties relevant to an experimental or natural situation. One common example of this kind of data visualization is the “cone of uncertainty” that is often used to show the development and predicted movements of hurricanes.
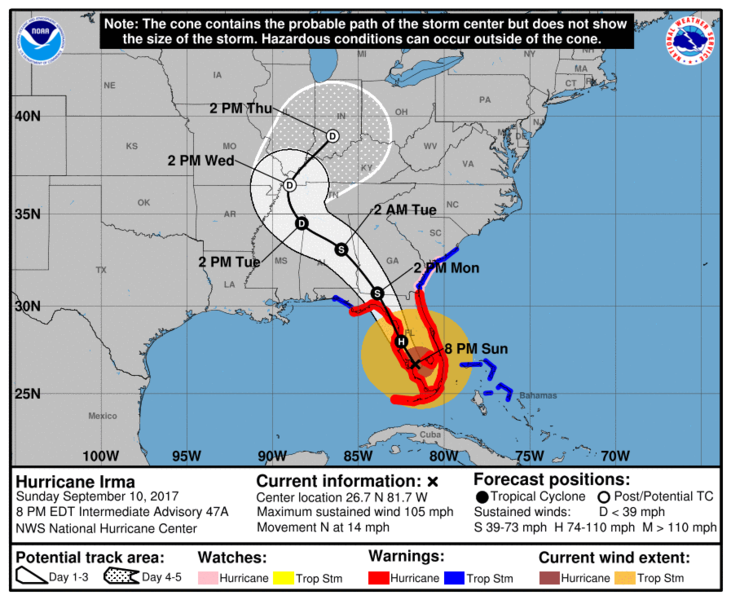
The National Oceanic and Atmospheric Administration uses cone of uncertainty models to predict the paths of hurricanes and tropical storms.
“That cone of uncertainty comes from all the unknown variables in the model and we want to be able to better communicate that information,” said Rosen.