2021 E-Insights Report
COVID-19 Impact on Consumer Spending
Consumer spending tracks the seven-day moving average credit/debit card spending by the people living in their respective MSAs relative to January 2020. Researchers calculated the percentage change of daily expenditures over the days with respect to January. They tracked the percentage change over 11 months for 20 MSAs.
They gathered the data for this through Opportunity Insights Economic Tracker. It combines anonymized data from leading private companies – from credit card processors to payroll firms – to provide a real-time picture of indicators such as employment rates, consumer spending, and job postings across counties. The data for consumer spending comes from Affinity Solutions, the world’s leading data-led intelligence platform. It buys data of first-party credit and debit card transactions daily which are anonymized for analysis.
The data available was at a daily county level. In order to aggregate it to the MSA level, scholars could not do a simple average, instead they opted to use a weighted average with per capita income of the county as a proxy. They gathered the per capita income data from U.S. Census Bureau and then multiplied the per capita income with population of the county and percentage change in spending on a daily basis and summed it by county. Researchers then summed the product of per capita income and population of each county and divided the former with the latter to get the percentage change for each MSA at a daily level.
Researchers note a decrease in consumer spending over time, which fell very sharply during March 15 through May 1. Numbers then rose, climbing closer to zero indicate that the relative expenditure is almost close to pre-pandemic levels in January. For some MSAs, consumers are spending more than they were pre-pandemic.
The major limitation with this data is the data source doesn’t mention to total sample population size taken into the analysis. Nonetheless, researchers believe this to be an accurate representation of the population and the trend.
Insights
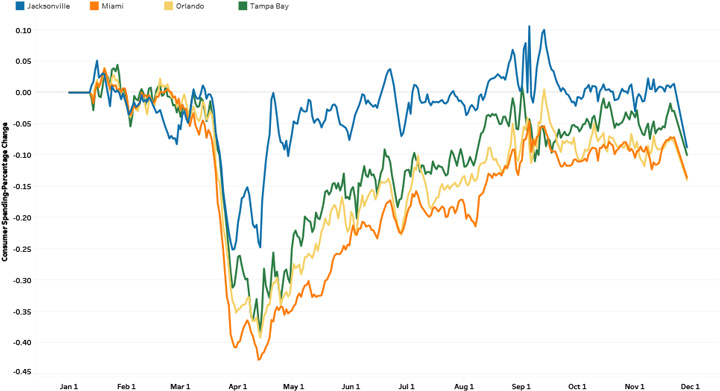
- For the Tampa Bay region, consumer spending dropped to 64 percent in mid-May and recovered to close to 100 percent of its January value by mid-October.
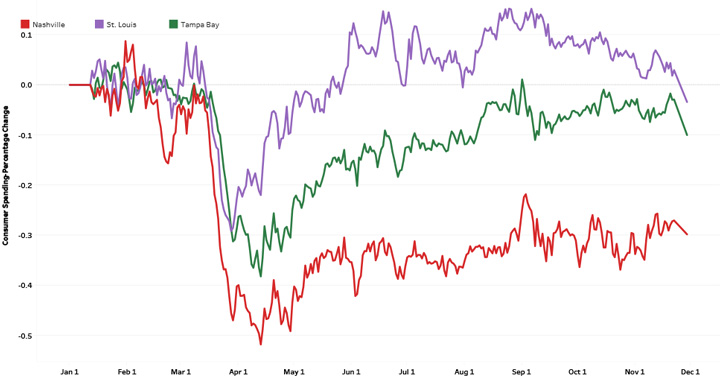
- The Nashville MSA experienced a drop to almost 50 percent and has recovered to only 70 percent of its January value.
- St. Louis consumer spending was 13 percent higher in September than that in January.
Consumer Spending-Percentage Change - Tampa
Consumer Spending-Percentage Change
Consumer Spending-Percentage Change - Florida