2024 E-Insights Report
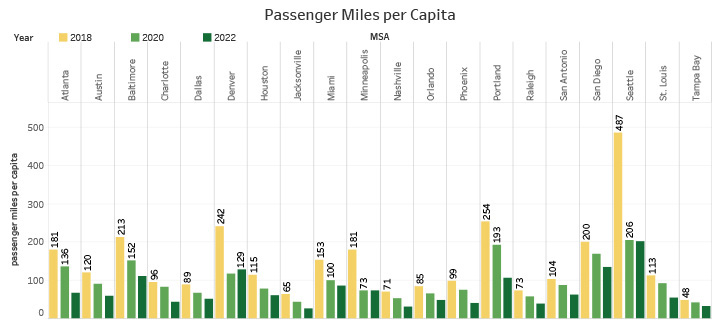
Passenger Miles per Capita
Passenger Miles per Capita
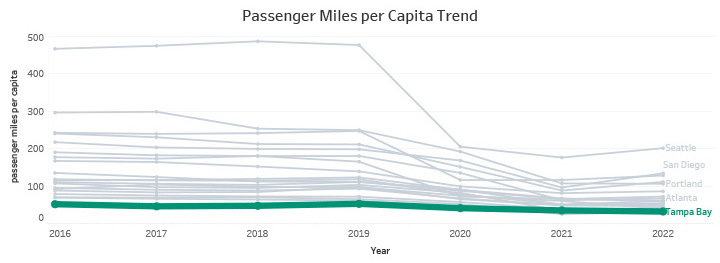
Passenger Miles per Capita Trend
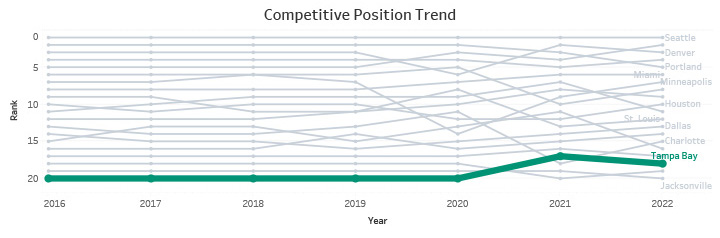
Competitive Position Trend
About: Measures the availability and usage of public transportation. Ratio of Miles traveled
by passengers in public transport to population for each MSA.
Source: Federal Transit Administration database [Data File - Annual Database UZA Sums].
- The Passenger miles per Capita for all the MSAs experienced a downward trend over the years. Seattle witnessed a massive decline in transit miles in 2019. Seattle ranked at the top consistently in transit miles per capita, offering robust and accessible public transportation.
- Tampa Bay consistently ranked at the bottom throughout the years except in 2021 and 2022 indicating limited public transportation services.