2024 E-Insights Report
Homeownership Rate
Homeownership Rate
Homeownership Rate
Competitive Position Trend
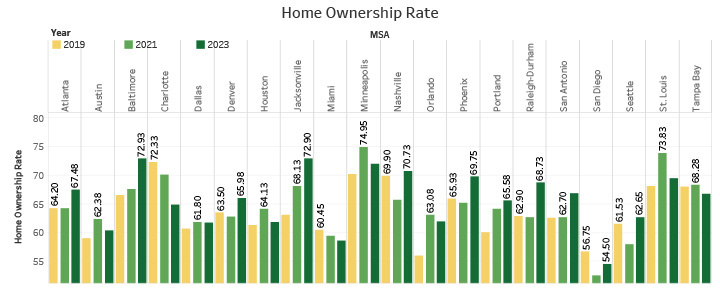
About: The percentage of U.S. homes that are owner-occupied. It is calculated by dividing
the number of homes that are owneroccupied by the total number of occupied households.
Only the data of Tampa-St. Petersburg-Clearwater was available for the Tampa Bay MSA.
Source: U.S. Census Bureau. (2023, October 31). Homeownership rate for the United States
[Data set]. U.S. Department of Commerce.
- Some regions including Dallas, Orlando and Austin witnessed an upward trend until 2020, after which the ownership rate started to drop. San Diego held the bottom position beginning in 2020 and Baltimore beat Jacksonville for the first position by a percentage difference of 0.03.
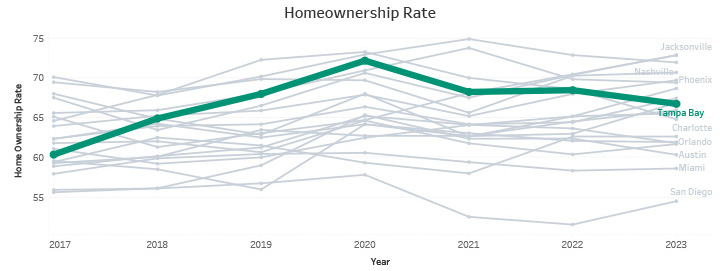
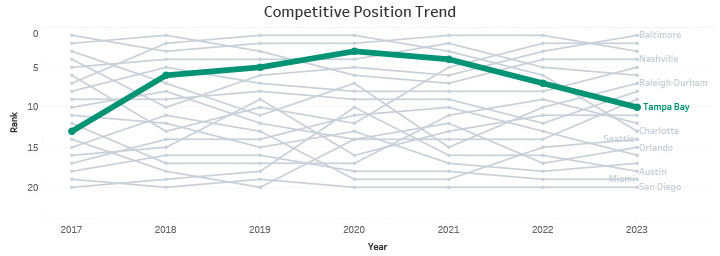
- The Tampa Bay region experienced an increasing trend in homeownership rates until 2020, after which the ownership rate declined. The Tampa Bay began at the 13th position and climbed up to the 3rd position in 2020, but experienced a decline in rankings and settled at the 10th position in 2023.