Written by Kristen Kusek, Former Communications Director for USF CMS
Scientists have warned us for years that we could be entering the sixth mass extinction event in planetary history – this time, caused by human activities. Escalating biodiversity loss threatens valuable ecosystem services and human well-being, from agriculture and fisheries, medicines and tourism.
We know that our activities are causing the extinction of some 1 million of the estimated 8 million plant and animals species on the planet. But monitoring and measuring biodiversity over any region and across the planet is hard to do. It’s a bit like trying to measure how many grams of sugar are in a pitcher of lemonade when the pitcher is leaking.
Complicating matters is the fact that scientists have different ways to measure and report on biodiversity, from a genetic level and classical taxonomy to measuring diversity of a whole ecosystem .
In a new publication in Nature Ecology & Evolution, a team led by Prof Dr. Andrew Skidmore from the University of Twente in the Netherlands share a new tool to add to the biodiversity toolkit: measuring biodiversity from space.
The team, which includes Dr. Frank Muller-Karger from the USF College of Marine Science, identified 120 essential variables that can be measured using satellite remote sensing data, such as land cover and ecosystem disturbances (e.g., how the land cover changes after a forest fire).
“This new method significantly enhances what we can see from field work on the ground, in our rivers, lakes, and in the ocean,” said Muller-Karger. “We still have a lot to do to refine the idea that we can measure the diversity of life from cameras orbiting the Earth, but it’s a great step forward at a time when we need it the most.”

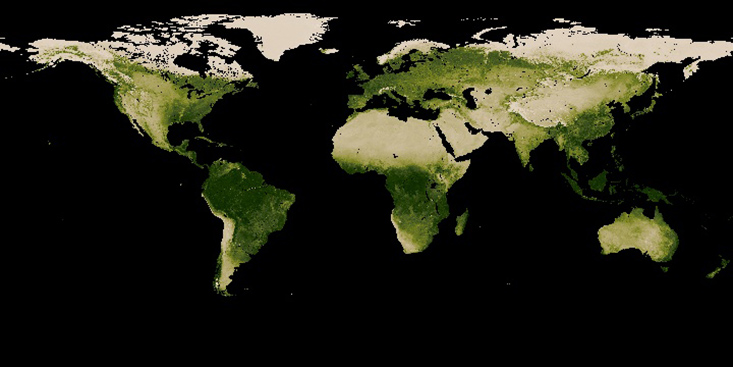
From space, satellites can see Earth breathe. A new NASA visualization shows 20 years of continuous observations of plant life on land and at the ocean’s surface, from September 1997 to September 2017. On land, vegetation appears on a scale from brown (low vegetation) to dark green (lots of vegetation); at the ocean surface, phytoplankton are indicated on a scale from purple (low) to yellow (high). This visualization was created with data from satellites including SeaWiFS, and instruments including the NASA/NOAA Visible Infrared Imaging Radiometer Suite and the Moderate Resolution Imaging Spectroradiometer. Credit: NASA
The method isn’t fool-proof. Genetic composition cannot be assessed using satellite data, for example. Also, changes in biodiversity can occur in different places and overtime, which is tough to do from space.
“It’s relatively easy to measure land cover in an area with a satellite and also how this changes over time. But we cannot operationally measure species abundance from space,” said Skidmore. Muller-Karger focuses much of his work on helping stand up a Marine Biodiversity Observation Network (MBON) to measure similar changes in coastal and marine areas around the US and working with international teams.
There is a gap in the work of ecologists, who developed ways to measure biodiversity, and remote sensing specialists, said Skidmore. Ecologists know what to look for to monitor biodiversity change, but often do not have the knowledge of remote sensing scientists and engineers about which products can be practically mapped from space.
“Both groups have to agree on what remote sensing products we have to focus on,” says Skidmore.
*This story leveraged information in the original press release written by the University of Twente.