Written by: Emily Kaiser
Every aspiring Antarctic marine geologist dreams of that first trip to the ice. But, when a global pandemic postpones those dreams, the next best destination is the Antarctic Core Collection at the Oregon State University Marine and Geology Repository (OSU-MGR-ACC).
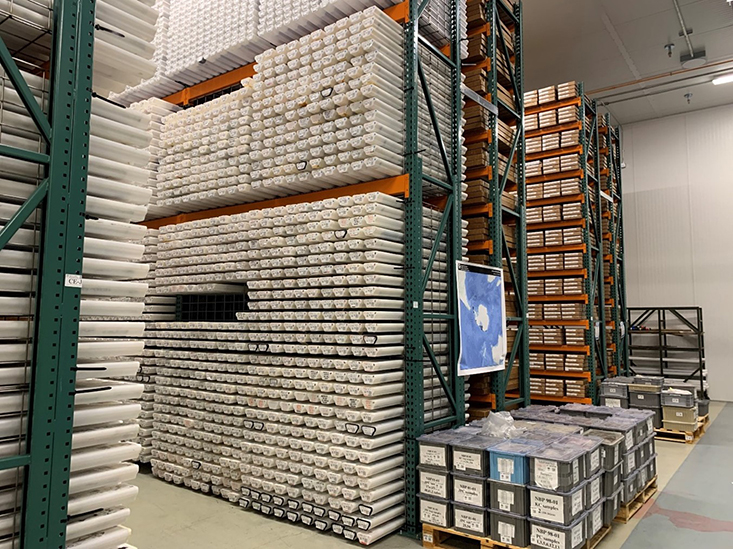
This National Science Foundation (NSF)-funded repository is a 33,000 square foot refrigerated library where scientists check out marine sediment cores and explore the stories contained within these cores, which take thousands to millions of years to write.
These stories are written as sediments accumulate on the seafloor. They enter the ocean basins via rivers and glaciers, winds, biologic production in the surface ocean, or are formed on the seafloor. These marine sediments are valuable archives of Earth’s climate system evolution.
Think of assembling cake. You put the bottom layer down first, then a layer of your favorite filling, another cake layer, and then icing on top. This stacking method is similar to how marine sediments are deposited: the deeper layers were deposited first, followed by younger, shallower layers. We need scientific research vessels to access these sediments beneath the seafloor, either by coring or drilling. Scientists aboard research vessels deploy core barrels that descend through kilometers of water and bore into these layers of sediments. Once the monitoring equipment onboard indicate that the core has plunged into the sediments, the scientists reel in the core.
When the ship is back ashore, these core archives are shipped to a number of different repositories around the globe, where they are carefully curated. Scientists can travel to these repositories and sample these archives for a variety of physical, geochemical, paleontological analyses to better understand how Earth’s climate system and oceans have changed through time.
Cores archived at OSU-MGR-ACC provide insight into Antarctica’s climate evolution. The collection represents all the cores sampled from Antarctica’s continental shelves and the Southern Ocean by NSF-funded scientists and the United States Antarctic Program (USAP).
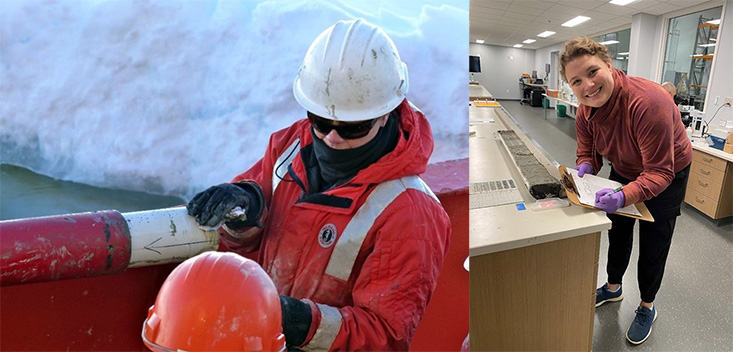
There’s still work to do! Dr. Amelia Shevenell (left) taking a core out of its core barrel during NBP14-02, a cruise she led as chief scientist. Eight years later, me describing my first core at OSU-MGR-ACC taken during the same cruise (right). It’s exciting to be expanding a project that my advisor helped envision!
I recently had the opportunity to visit the OSU-MGR-ACC to sample the marine sediment cores I am planning to analyze for my dissertation research. I travelled with my USF advisor, Dr. Amelia Shevenell and two committee members, Dr. Brad Rosenheim (USF) and Dr. Amy Leventer (Colgate University). Collectively, they have been on 40 Antarctic research onshore expeditions or research vessel-based expeditions on the International Ocean Discovery Program drilling vessel, the JOIDES Resolution, and the two USAP vessels, the RVIB Nathanial B. Palmer and ARSV Laurence M. Gould. In fact, many of the cores we sampled came from USAP cruises led by Dr. Shevenell and Dr. Leventer!
True Grit: how mud can tell a story
The goal of our visit was to visually describe cores and take samples for radiocarbon, physical, and geochemical analyses. While the geochemical analyses wait until we were back at the College of Marine Science, we visually described the sediments present, including color, microfossils, grainsize, and structures (e.g., burrows). While we can clearly see rocks and gravel in the cores, to figure out how much sand or clay is in the sediments – this is the part where you can get a little dirty – you take a small sample and feel the “grit” (we will do a more qualitative analysis later, but it’s a start!). Finally, we take a tiny sample with a toothpick, smear it on a microscope slide, and look at the sample under the microscope – this sample is called a “smear slide”. Taking a closer look, we can see what types of sediments and microfossils, including diatoms (marine phytoplankton, Dr. Leventer’s specialty) are abundant in the sample. These preliminary analyses help us decide where to sample for further geochemical and micropaleontologic analyses.
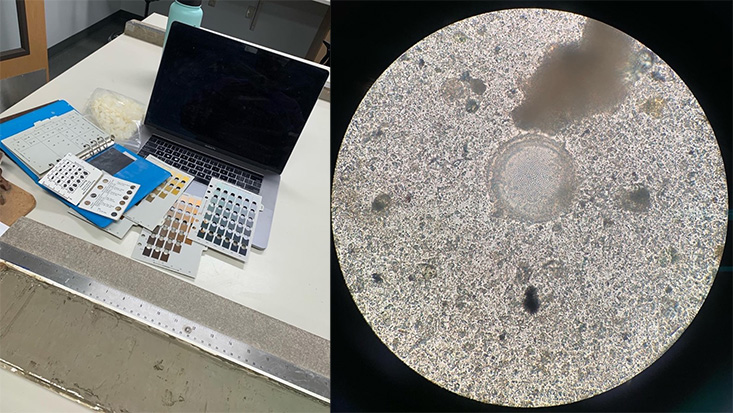
Tools we can use at the core repository before sampling. On the left was my typical core description station: a color chart and a grain size chart. On the right is a smear slide sample under the microscope with a large, centric diatom in the middle!
My research focuses on the last deglaciation, a period of rapid climate warming (~23,000 to 11,000 years ago) after the last Ice Age and when Antarctica’s ice sheets were expanded. As climate warmed, Antarctica’s ice sheets retreated landward from their maximum extent. However, the timing, rates, and mechanisms driving ice retreat are not well understood.
To explore the timing of past ice retreat, I took samples from the archived cores for radiocarbon dating. Because I am using multiple cores that are collected across the continental shelf in each of my study regions, I will attempt to calculate the rates of deglacial ice retreat. Once I establish the timing and rates of retreat, I plan to study the drivers of ice retreat. For example, does ice retreat when ocean waters are warm? Or when atmospheric temperatures are warm, as indicated by records from Antarctic ice cores. Understanding how ice sheets changed in the past help us better understand and predict how glacial ice will behave in the future – which can give us better estimates of the magnitude and rates of future sea level rise.
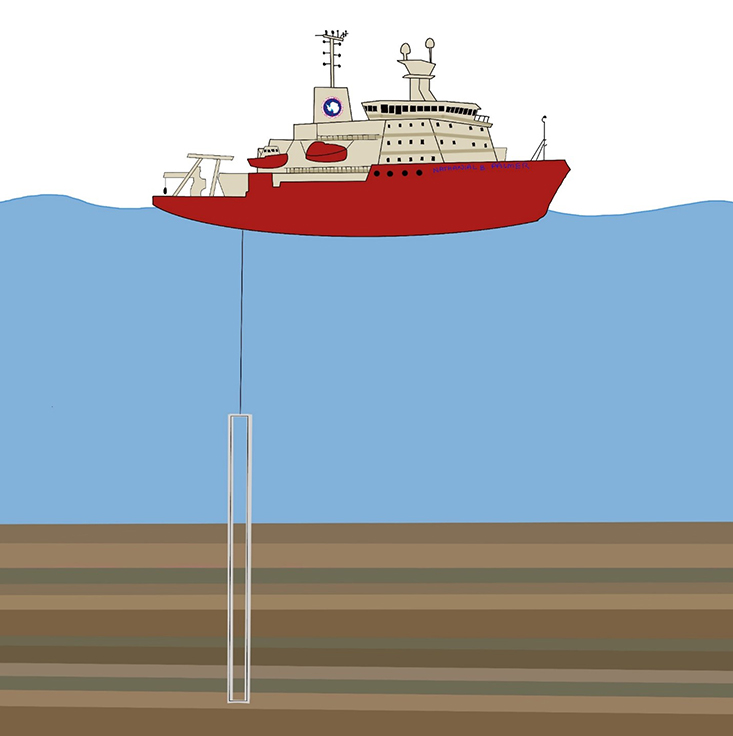
Diagram of a sediment core being taken from the US Antarctic Program’s icebreaker, the Nathanial B Palmer. Coming from the ship, the silver tube represents a core barrel cutting into the sediments on the sea floor. The different, layered colors indicate changes in sediment type. These changes in sediment type can be used to infer changes in climate through time. Credit Emily Kaiser, PhD student.
Past is key to the present
Unfortunately, we recently learned how critical it is to fill in the gaps of knowledge of Antarctica’s sensitivity to climate change. While we were at OSU-MGR-ACC, the Conger Ice Shelf in East Antarctica collapsed possibly related to record-breaking atmospheric temperatures in East Antarctica. This ice shelf was right around the corner from one of my study sites, the Sabrina Coast, home to the Totten Glacier which is a rapidly thinning glacier.
This event came as a surprise. Conventionally, Antarctic scientists thought that the East Antarctica ice sheet was not sensitive to warming climate. If we had cores from the area around the Conger glacier theoretically those samples could have helped us to realize how sensitive these regions are to climate change.
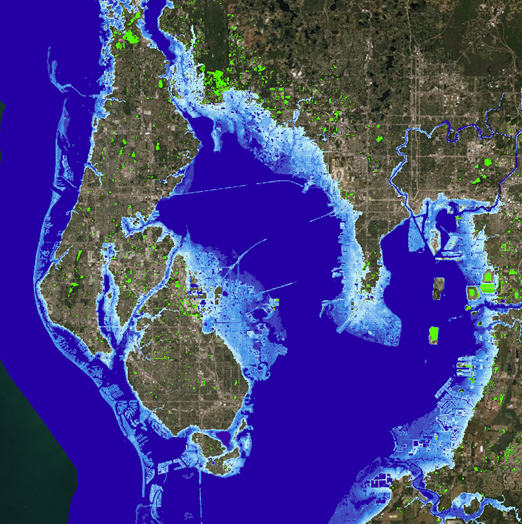
Tampa Bay region flood map if sea level were to rise 3 meters (NOAA Office for Coastal Management). Explore how your neighborhood may be impacted by using this app!
Understanding the sensitivities of Antarctica’s glaciers are necessary because ice mass loss causes sea level to rise. Outlet glaciers along the Sabrina Coast contain 5.13 meters of sea level equivalent ice, which is the volume of water estimated be added to the ocean when melted. Melting ice from Antarctica is linked to observed sea level rise, and directly impacts low lying, coastal regions, such as Florida.
Through my dissertation I hope to shed light on patterns of ice retreat in the geologic record to help predict events such as this in the future. In the meantime, I am patiently waiting for my mud samples to arrive in the mail.