This post was contributed by the lab leaders, Kelly Vasbinder and Dr. Marcy Cockrell.
Lab: Fisheries and Habitat Conservation
Lab leaders: Kelly Vasbinder (Ph.D. student at the USF College of Marine Science)
and Dr. Marcy Cockrell (Science mentor)
Lab days are here! During the second and third week of camp, campers participate in 2 lab sessions! We led the fisheries lab, where girls learned how we measure fish populations and conserve ocean habitat. Campers learned about marine protected areas (MPAs) and the approaches scientists use to study fish populations. The girls had the chance to get up close and personal with some of the technologies and models that scientists use to design and test management strategies.
Day 1 started with a introduction in the computer lab where the girls got familiar with some of the terms scientists use to talk about conserving ocean resources (like “overfishing” and “sustainable production”), as well as learning how the United States manages fisheries and what scientists need to know to keep a fishery sustainable. They learned about how the MPAs can be used to protect certain areas of the ocean, and what different kinds of MPAs can be implemented, as well as where they are in the US today. Then, it was time for some activities to learn about mapping and designing an MPA!
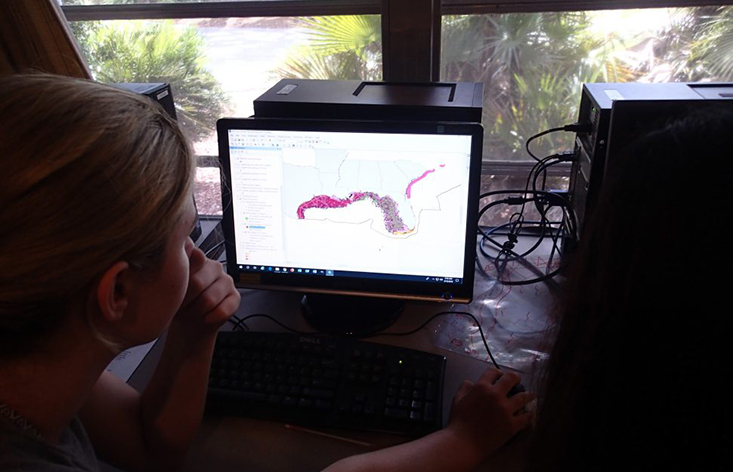
First, the girls learned how maps are conceptualized using what’s called “layers.” Each piece of information we see on a map or GPS is a “layer” of information, and we illustrated this by drawing different layers on transparencies to represent Clam Bayou. The girls then worked as a team to design their very own MPA to solve a conservation problem (like balancing sea turtle conservation with sustained lobster fishing). They worked on the computers using mapping software to determine the data and layers they needed to solve the conservation problem at hand. They then chose the location, shape, size, timing, and regulations for an MPA that would help solve the problem, but also balance the needs of all the different groups involved.
Day 2 started off with a simulation game: fishing for pennies! The campers got to use pennies to make their own “catch curve” models. Catch curves use a “snapshot” sample method to allow scientists to determine the ages of the fish in the population and therefore figure out the mortality rate, or death rate, of the population each year. Pennies are “born” when they are minted, so the girls sorted the pennies into age classes and then we plotted the data! We learned how to take a natural logarithm so that the model we fit to our data would be linear. The slope of the linear model is our mortality rate! The girls did a great job aging the pennies and constructing the catch curve. After an introduction to modeling, we played a game with Swedish fish to emphasize the strategy behind deriving equations for models. The Swedish fish represented our fish population, and the girls figured out how to incorporate birth, death, fishing, and migration into an equation that would model the population and allow us to calculate the population size in the next year.
Finally, it was time to use the equation that the campers derived to build a population dynamics model on the computer with Excel! The campers got to construct a common model used for assessing fish populations called the “Surplus Production Model”, which is sometimes called the “Schaefer Model.” We used Excel to construct the model, and the girls were excited and eager to learn how to use all of the features to create dynamic equations. After setting up the model and making a plot of the fish abundance through time, girls got to “fish” the population at different harvest rates by changing the model parameters and watching what happened to the abundance plot. After fishing at a range of harvest rates, the girls were able to determine the “Maximum Sustainable Yield” of the population and figure out what level fisheries should be operating at to remain sustainable! The campers did a great job learning how to build a model from beginning to end: identifying a problem, creating an equation to model the problem, and then building a model to test solutions! Our fisheries lab came to a close with a quiz game to test what they learned about MPAs, fisheries, and modeling. The ladies did great and got every answer right! We enjoyed having them in the fisheries lab and we can’t wait for next time!