Written by: Sarah Grasty-Prueitt
After three postponements due to COVID-19 and a slew of weather fronts ending with Hurricane Zeta in October 2020, scientists from the Center for Ocean Mapping and Innovative Technologies (COMIT) were able to safely set sail to the northeastern Gulf of Mexico in February 2021. Their mission aboard the R/V W.T. Hogarth: to map the seafloor in areas that have been prioritized by NOAA’s Integrated Ocean and Coastal Mapping Program (NOAA IOCM; see map below), the Florida Coastal Mapping Program (FCMaP), Florida’s Division of Aquaculture, and NOAA’s National Centers for Coastal Ocean Science Coastal Aquaculture Siting and Sustainability (NCCOS-CASS). Despite bathymetry being important to fishing operations, safe navigation, and industrial shipping, to name a few, modern seafloor depth information is available for less than 2% of the Big Bend region.
The team, led by Chief Scientist Matthew Hommeyer, broke some personal records for data collection during their eleven days at sea. For example, they collected the largest amount of mapping data in one field expedition since beginning their mapping efforts in 2015: 600 km2 (about a third of the size of Pinellas County). The personal bests were largely due to the group’s use of an underway sound velocity profiler, or underway SVP, to handle the challenging oceanographic conditions in this part of the Gulf of Mexico.
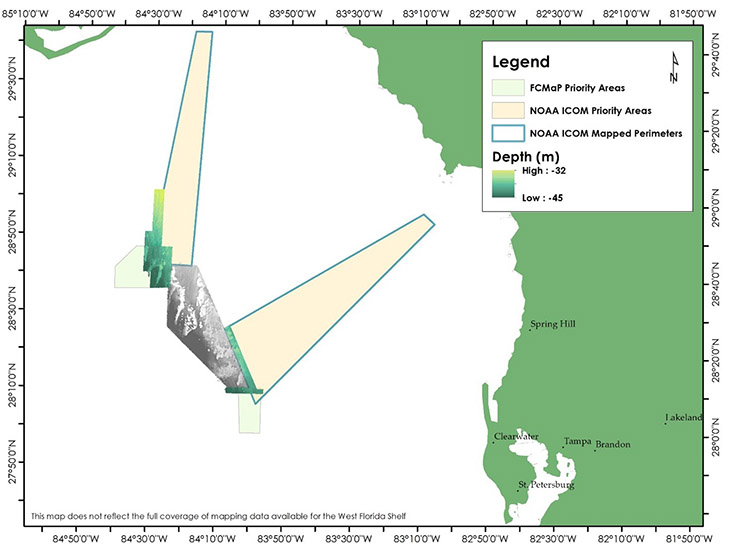
The light green and orange polygons in the map above show the areas in the Big Bend of Florida that are prioritized for mapping by the Florida Coastal Mapping Program (FCMaP) and NOAA’s Integrated Ocean and Coastal Mapping (IOCM) Program. The depths shown in grayscale were mapped by David Naar, PhD, a CMS Geological Oceanographer, in the mid-2000s. The areas indicated by the yellow to blue color depth scale were mapped by Hommeyer and his team in October 2020 and February 2021; this also includes the perimeters of the two NOAA IOCM areas indicated by the blue outlines.
The SVP wins the cruise ‘MVP’ award
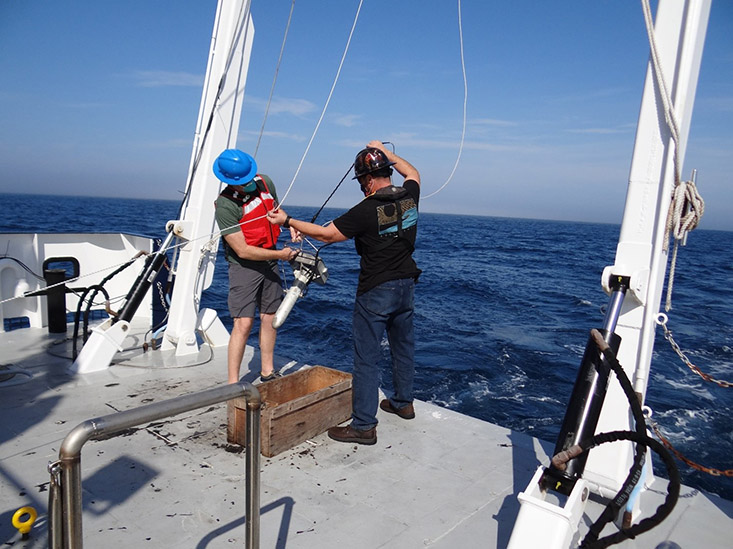
The underway SVP consists of a winch spooled with cable that is attached to a 30-lb metal towfish. A sensor inside the metal portion measures how sound propagates through the water column – critical information when using sound to measure seafloor depth. Once deployed behind the vessel, the underway SVP can be left trailing behind the boat throughout the duration of the cruise. Sound velocity profiles (SVPs) are then collected at the push of a computer button inside the lab.
Without the underway SVP, Hommeyer and his team would’ve had to stop their mapping operations and then use a much larger piece of equipment to collect sound velocity data while stationary. In relatively stable water masses, a new profile is needed every four to six hours. In more dynamic water masses, such as several areas where the team was working in the Big Bend, a new profile may be needed every ten to fifteen minutes. Even in the relatively shallow waters of the Big Bend, each stationary cast would take about fifteen to twenty minutes to complete. Being able to remain underway while collecting this information represented a significant operational time savings.
The team collected almost 200 sound velocity profiles. For context, they would usually top out at about 30 to 40 profiles over the same amount of time using the stationary profile approach. Aside from the sheer amount of data they were able to collect and use to improve the quality of the bathymetric maps, these data will also be used by COMIT Co-PI, Bob Weisberg, PhD, a physical oceanographer at CMS, to investigate refinements to model-forecasted sound velocity for improved accuracy and resolution.
On the first day of fieldwork, the group also deployed an oceanographic glider in the area they were mapping. The USF CMS glider program regularly sends these autonomous robots out in the Gulf of Mexico and Atlantic Ocean to study hurricanes, red tide, and fish populations. Glider program director, Chad Lembke, often calls them the “pickup trucks” of uncrewed oceanographic research. In this case, the glider was equipped with sensors to collect the same data as the underway SVP. These concurrent datasets are now being analyzed to determine if gliders can provide a viable method for collecting SVP data of comparable quality to the casts taken aboard the ship. If the answer is ‘Yes’, this could mean that gliders may be practical platforms for amplifying SVP data collection during future mapping efforts.
“Between a glider deployment, the large amounts of oceanographic data we collected with the underway SVP, and the mapping coverage which ticks the boxes of several stakeholder groups, this ended up being an incredibly productive cruise that was well worth the hurdles we encountered throughout 2020,” said Hommeyer. “We’re looking forward to the next opportunity to get back out there, and hopefully it’ll be safe to have some students involved next time.”
Collaborating with the State of Florida, Building Momentum
When the Big Bend Project began in late-2019, the prioritized areas included only those from NOAA IOCM and FCMaP. But an 11th-hour meeting with the State of Florida’s Division of Aquaculture between the first and second legs of their February fieldwork spurred an immediate plan for collaboration between the State and COMIT; the State of Florida’s Division of Aquaculture and NOAA’s NCCOS-CASS are in need of bathymetric data to further refine areas sited for offshore aquaculture leases.
As luck had it, several of their priority areas overlapped or were nearby to those already being surveyed within the Big Bend by COMIT.
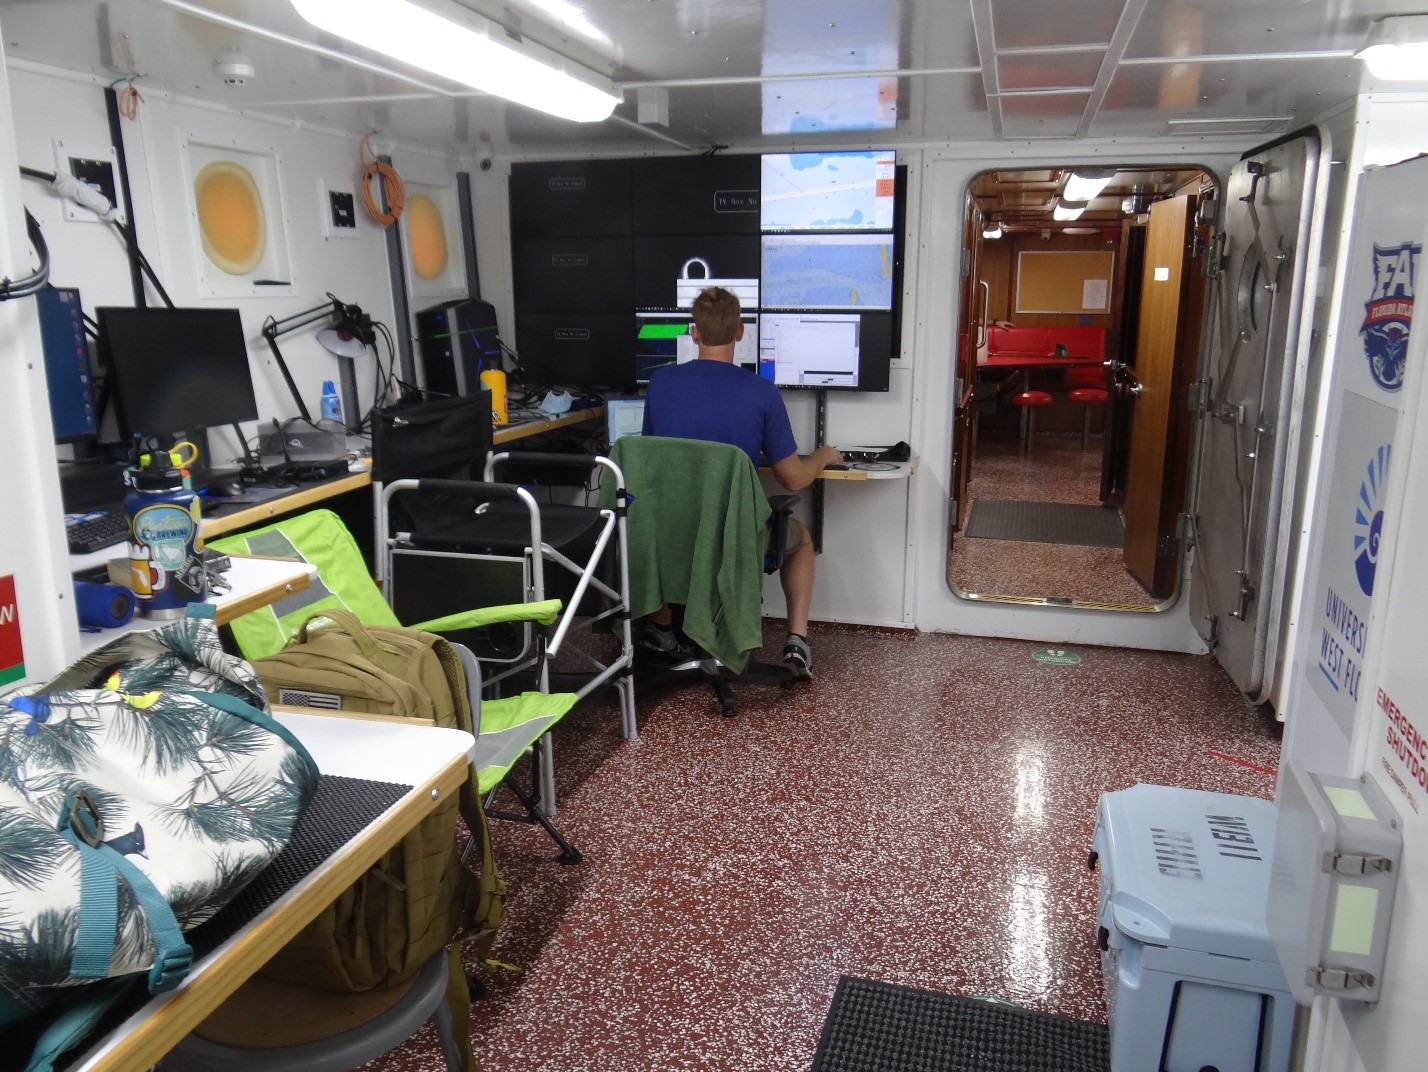
Matthew Hommeyer, COMIT’s Technical Operations Manager, prepares the multibeam echosounder system to collect bathymetry data in the lab aboard the R/V W.T. Hogarth.
COMIT and the Division of Aquaculture/NCCOS-CASS will continue their collaboration to bolster the availability of high-quality data in support of Blue Economy initiatives such as offshore aquaculture. Hommeyer and team also anticipate continued work with NOAA-IOCM to map in the 20- to 200-meter depth zones off Florida’s Gulf Coast. This not only supports the needs of local stakeholders, but it aligns with priorities outlined in the recent National Strategy for Ocean Mapping, Exploring, and Characterizing the US Exclusive Economic Zone plan (NOMEC) released by NOAA in early 2021, as well as the Seabed 2030 initiative which aims to have global oceans mapped by 2030.
One thing is certain: CMS’s mapping group is eager and ready to get back out to sea and continue to map the gaps.
The Big Bend Demonstration Project team would like to thank NOAA’s Integrated Ocean and Coastal Mapping Program (Grant NA19NOS0220048) for funding this work as well as FIO’s captain and crew for their field support. Much appreciation to Ashley Chappell and Paul Turner of NOAA OCS for their guidance throughout the project.