MATLAB Resources
Johnson System of Distributions Johnson Curves
Johnson Curves
Johnson (1949) developed a flexible system of distributions, based on three families
of transformations, that translate an observed, non-normal variate to one conforming
to the standard normal distribution. The exponential, logistic, and hyperbolic sine
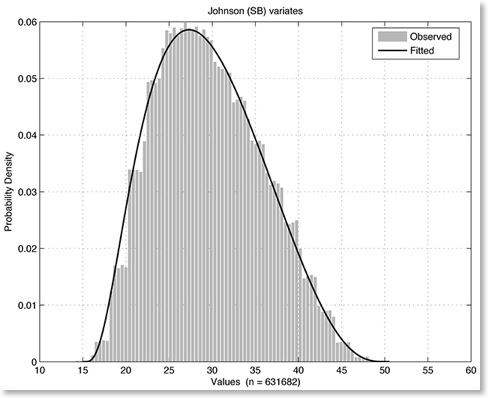
transformations are used to generate log-normal (SL), unbounded (SU), and bounded
(SB) distributions, respectively. The coefficients defining a Johnson distribution
consist of two shape (γ, ?), a location (ξ), and a scale (λ) parameter. This allows
a unique distribution to be derived for whatever combination of mean, standard deviation,
skewness, and kurtosis occurs for a given set of observed data. Once a variate is
appropriately transformed, probability densities and percentage points may be derived
based on the standard normal curve.
Johnson’s (1949) original procedure for determining the transformation coefficients
was based on moments derived from the observed data and he used a graphical calculator
(i.e., an abaque) to perform his calculations. Draper (1952) suggested algebraic formulae
to replace the abaque for increased accuracy. Hill et al. (1976) provided a FORTRAN
algorithm to fit Johnson curves based on moments and Hill (1976) published a companion
program for transforming observed (Johnson) variates to their standard normal counterparts,
and vice versa. Wheeler (1980) derived an alternative method of fitting Johnson distributions
to data based on quantiles instead of moments.
The flexibility inherent in the Johnson system of distributions offers a compelling
alternative to the conventional distributions routinely employed in the analysis of
real-world data sets. It has potential for widespread use in a variety of disciplines,
including aerospace engineering (Tielrooij et al. 2015), atmospheric chemistry (Mage,
1980), bioinformatics (George & Ramachandran, 2008; Marko & Weil, 2012), biomechanics
(Stanfield et al., 1996), biomedical engineering (Breton & Kovatchev, 2008), climate
modeling (Liu, 2012), econometrics (Lu, et al., 2008; Simonato, 2011), engineering
(Farnum, 1996), forest science (Hafley & Schreuder, 1977), management science (Alexopoulos
et al., 2008), materials science (Matthews et al., 2006), occupational hygiene (Flynn,
2007), psychometrics (den Oord, 2005), and remote sensing (Ben-David & Davidson, 2012).
The Johnson Curve Toolbox for Matlab is a set of Matlab functions for working with the Johnson family of distributions
to analyze non-normal, univariate data sets. Portions of it are based on my port of
the AS 99 (Hill et al., 1976) and AS 100 (Hill, 1976) FORTRAN-66 code. The Toolbox
provides support for fitting Johnson curves to data based on moments or quantiles;
using Johnson transformations to convert Johnson variates to normal variates (and
vice versa); generating random numbers from Johnson distributions; calculating probability
densities (PDF), cumulative probability densities (CDF), and inverse CDF’s; and calculating
likelihoods and goodness-of-fit measures. Examples of fitting Johnson curves to biological,
environmental, demographic, and financial data are also provided.
Citation
Jones, D. L. 2014. Johnson Curve Toolbox for Matlab: analysis of non-normal data using
the Johnson family of distributions. College of Marine Science, University of South
Florida, St. Petersburg, Florida, USA.
Download the Johnson Curve Toolbox for Matlab
References
Alexopoulos, C., D. Goldsman, J. Fontanesi, D. Kopald, and J. R. Wilson. 2008. Modeling
patient arrivals in community clinics. Omega 36: 33-43.
Ben-David, A. and C. E. Davidson. 2012. Probability theory for 3-layer remote sensing
radiative transfer model: univariate case. Opt. Express 20(9): 10004-10033.
Breton, M. and B. Kovatchev. 2008. Analysis, modeling, and simulation of the accuracy
of continuous glucose sensors. J. Diabetes Sci. Technol. 2(5): 853-862.
Draper, J. 1952. Properties of distributions resulting from certain simple transformations
of the normal distribution. Biometrika 39: 290–301.
Farnum, N. R. 1996. Using Johnson curves to describe non-normal process data. Quality
Engineering 9(2): 329-336.
Flynn, M. R. 2007. Analysis of exposure–biomarker relationships with the Johnson SBB
distribution. Ann. Occup. Hyg. 51(6): 533–541.
George, F., and K. M. Ramachandran. 2008. A mixture model approach for gene selection
using Johnson’s system and Bayes formula. Neural, Parallel, & Scientific Computations
16: 45–58.
Hafley, W. L. and H. T. Schreuder. 1977. Statistical distributions for fitting diameter
and height data in even-aged stands. Can. J. For. Res. 7: 481-487.
Hill, I. D. 1976. Algorithm AS 100: Normal-Johnson and Johnson-Normal transformations.
Journal of the Royal Statistical Society. Series C (Applied Statistics) 25: 190–192.
Hill, I. D., R. Hill, and R. L. Holder. 1976. Algorithm AS 99: Fitting Johnson curves
by moments. Journal of the Royal Statistical Society. Series C (Applied Statistics)
25: 180–189.
Johnson, N. L. 1949. Systems of frequency curves generated by methods of translation. Biometrika 36: 149–176.
Liu, F. 2012. Development and calibration of central pressure filling rate models
for hurricane simulation. Unpublished M.S. Thesis, Clemson University; 130 pp.
Lu, Y., O. A. Ramirez, R. M. Rejesus, T. O. Knight, and B. J. Sherrick. 2008. Empirically
evaluating the flexibility of the Johnson family of distributions: a crop insurance
application. Agricultural & Resource Economics Review 37(1): 79-91.
Matthews, J. L., E. K. Lada, L. M. Weiland, R. C. Smith, and D. J. Leo. 2006. Monte
Carlo simulation of a solvated ionic polymer with cluster morphology. Smart Mater.
Struct. 15: 187–199.
Mage, D. T. 1980. An explicit solution for SB parameters using four percentile points.
Technometrics 22(2): 247-251.
Marko, N. F. and R. J. Weil. 2012. Non-Gaussian distributions affect identification
of expression patterns, functional annotation, and prospective classification in human
cancer genomes. PLoS ONE 7(10): e46935. doi:10.1371/journal.pone.0046935
Simonato, J. G. 2011. The performance of Johnson distributions for value at risk and
expected shortfall computation. Journal of Derivatives 19: 7-24.
Stanfield, P. M., J. R. Wilson, G. A. Mirka, N. F. Glasscock, J. P. Psihogios, and
J. R. Davis. 1996. Multivariate input modeling with Johnson distributions. Proceedings
of the 1996 Winter Simulation Conference; 8 pp.
Tielrooij, M., C. Borst, M. M. van Paassen, and M. Mulder. 2015. Predicting arrival
time uncertainty from actual flight information. Eleventh USA/Europe Air Traffic Management
Research and Development Seminar (ATM2015); 10 pp.
van den Oord, E. J. C. G. 2005. Estimating Johnson curve population distributions
in MULTILOG. Applied Psychological Measurement 29(1): 45–64.
Wheeler, R. E. 1980. Quantile estimators of Johnson curve parameters. Biometrika 67:
725–728.
Download the student version of The Johnson Curve Toolbox requires Matlab