By Carlyn Scott, Science Communications Assistant
In a serendipitous research cruise this summer, three labs within the USF College of Marine Science, plus its glider fleet team, joined forces to improve our understanding of a decades-old question: what causes red tides to form in the Gulf of Mexico?
“In recent years my opinion is that we’ve tended to approach oceanography in a less than interdisciplinary way, but what we need is exactly the opposite,” said Dr. Bob Weisberg, a recently retired physical oceanographer who developed a computer model that is used to predict when red tides will occur, and where they will move based on winds, tides, and currents.
“What sparked our collaboration on this cruise was the need to understand the interdisciplinary controls that spark these blooms. Red tide, like any aspect of ecology, is an interdisciplinary problem,” said Weisberg. These blooms only occur in a perfect mixture of ecology, chemistry, physical conditions, and biology.
This cruise was an important one for the five-year (2020-2025) Center for Red Tide Tracking and Forecasting at the CMS, whose mission is to develop new interdisciplinary approaches to tracking and forecasting red tides on the West Florida Shelf causes by the phytoplankton Karenia brevis.
West Florida Coastal Ocean Model-based Red Tide tracking forecasted trajectories at upper water column on the West Florida Shelf developed by the Ocean Circulation Lab. Black lines represent simulated drifter trajectories.
“Currently, red tide predictions rely primarily on models of ocean circulation to tell us when to expect nutrient delivery to the shelf via upwelling,” said Dr. Kristen Buck, a chemical oceanographer who leads the Center for Red Tide Tracking and Forecasting.
In the past, there has been good agreement between circulation models and K. brevis blooms, which gives some confidence in the predictions. However, Buck aims to tease out the specific nutrients carried by the circulation patterns that may be causing blooms. A recent cruise that was part of the Gulf of Mexico trace metal time series (GoMeTS) helped take a step forward in this work.
“With GoMeTS we are quantifying the nutrient budgets in the water column, while also expanding the definition of nutrients to include micronutrients and trace metals such as iron, to get a better sense of the entire system,” said Buck.
Here’s how the teams came together:
- Dr. Kristen Buck’s chemical oceanography lab led a cruise aboard the R/V Weatherbird II from June 13 -19, 2022. This cruise was part of GoMeTS, a group that goes out twice a year, in the late summer and fall, to survey the West Florida Shelf before and during Karenia brevis bloom events. The cruise aims to collect surface trace metal samples, water column macronutrient samples, chlorophyll, and absorbance across the West Florida Shelf over an inshore-offshore transect. Buck’s graduate student, Naja Murphy, served as co-PI on the cruise. (The cruise is also executed in collaboration with the Knapp Lab at Florida State University, the Chappell Lab at Old Dominion University, and the Garret and Hubbard lab at the Florida Fish & Wildlife Conservation Commission).
- Dr. Weisberg’s physical oceanography lab, now led by Dr. Yonggang Liu, developed a computer model that monitors the Loop Current in the Gulf, which plays a critical role in the occurrence of red tides. The data collected during the cruise will help refine the models.
- Dr. Chuanmin Hu’s optical oceanography lab provided real-time satellite imagery prior to and during cruise. Jennifer Cannizzaro, research scientist in the Hu lab, identified ocean surface features that the cruise would encounter, such as the Loop Current and the Mississippi River plume. She also notified the team about areas with large Sargassum blooms to avoid.
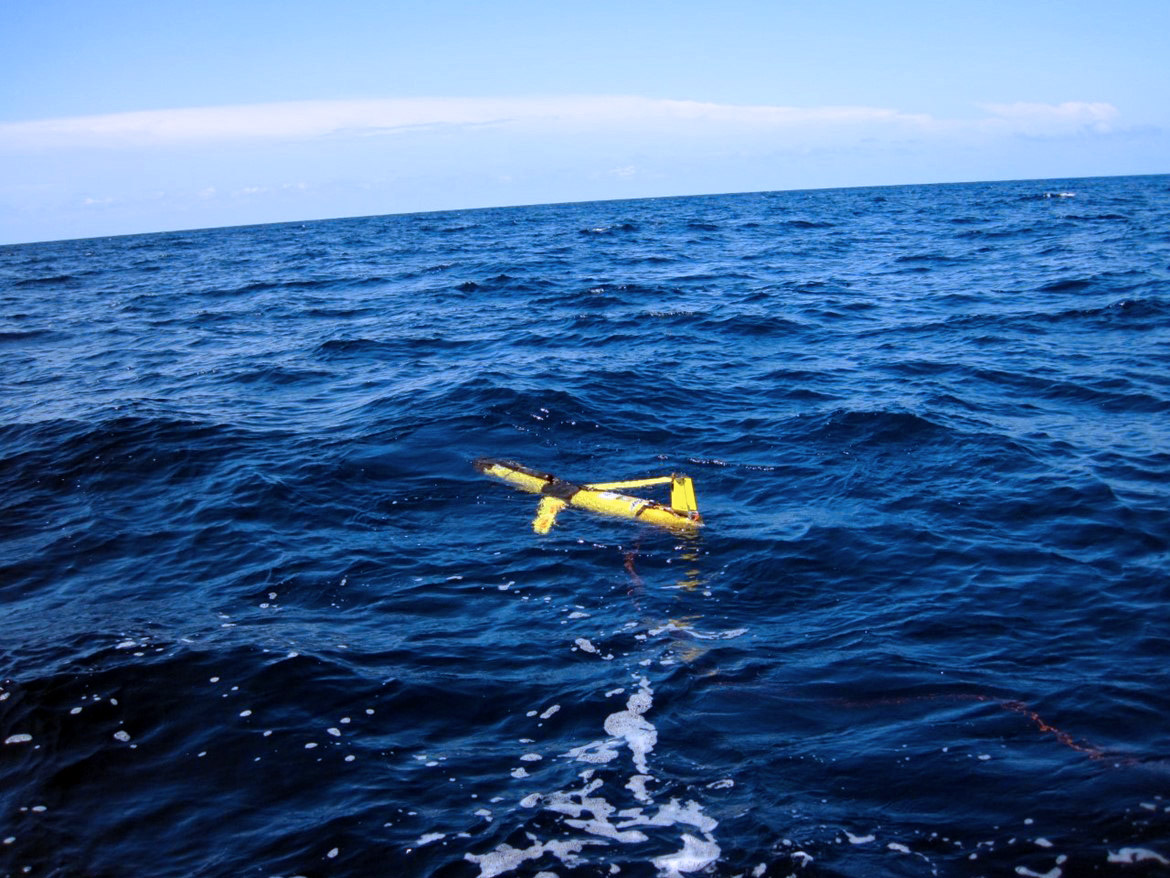
- Chad Lembke, who heads the Center for Ocean Technology and the CMS glider fleet, deployed a glider that came as close as ever before to the ship while on the expedition. The glider monitored in real time the physical and chemical properties (e.g., temperature, salinity, colored dissolved organic matter (CDOM), dissolved oxygen) of the water column. These data also help refine the computer models.
While gliders have been used to collect data that validate models before, this deployment very closely surveyed the ships’ path ahead so that more accurate comparisons could be made.
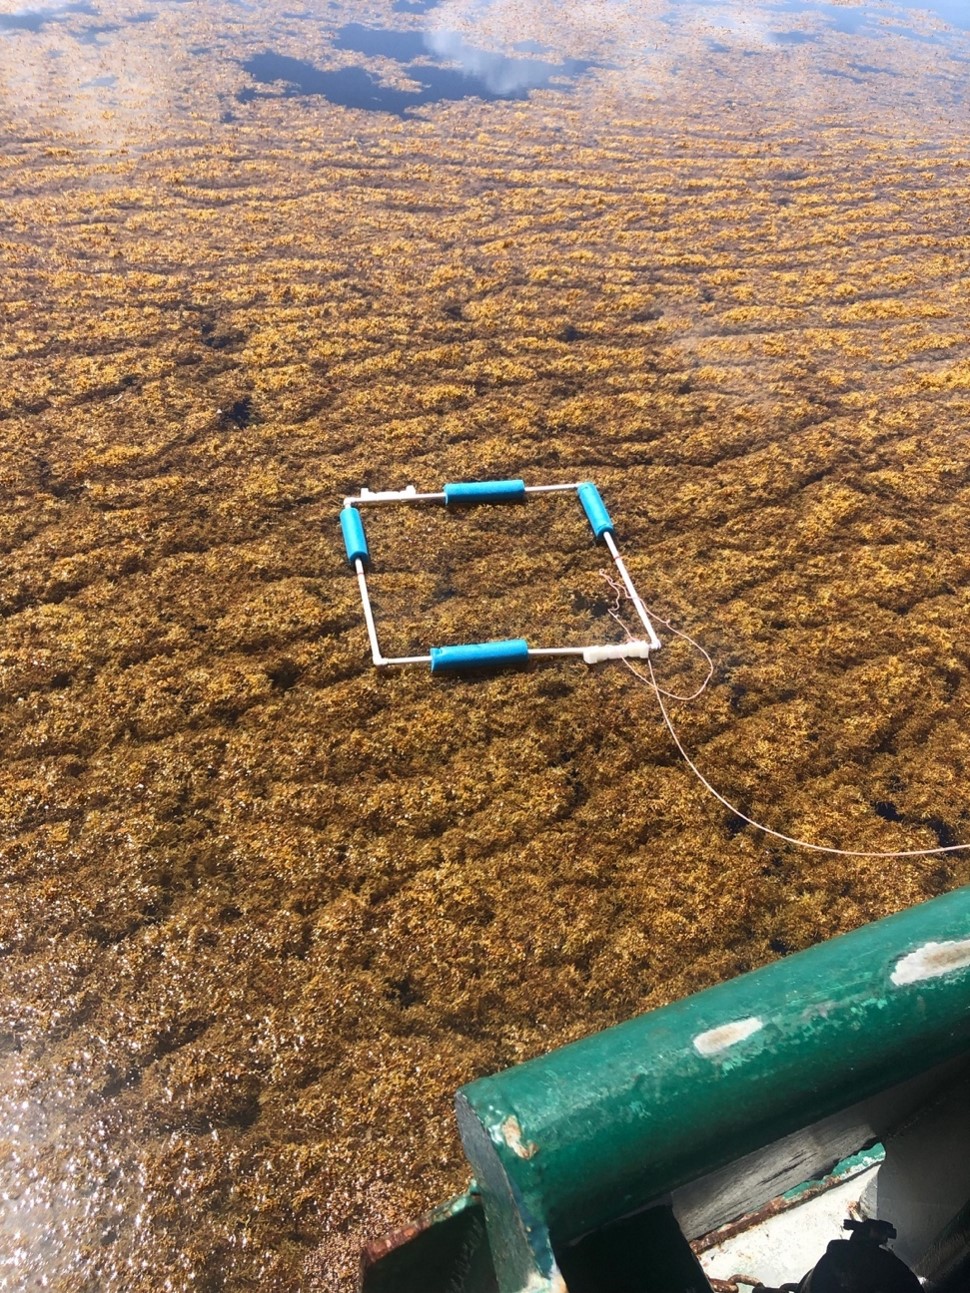
Members of the Hu lab, graduate students Sam Bunson and Sarah Sullivan, measure Sargassum density in the West Florida Shelf. Photo credit, Dr. Dreux Chappell, Old Dominion University.
In addition to more typical measurements for Lembke’s team, the glider had a new sensor to try out. “This glider was mounted with a SUNA nitrate sensor,” said Lembke, “so we also had this opportunity for the first time to make a direct comparison with the traditional shipboard nutrient sampling that Buck’s group was doing on the boat.”
“By ground-truthing this remote sensing data with both the glider and shipboard measurements, we are able to firm up the connections between the biology and chemistry,” said Buck.
The glider was a welcome addition to the mission, as it can measure temperatures in the water column. “If we see temperatures on the outer shelf at about 18 degrees or less,” said Weisberg, “we know we will see upwelling of nutrients on the shelf.”
That’s important because the current hypothesis is that red tide blooms begin towards the mid-shelf region (10-40 miles offshore) where it is generally oligotrophic (low nutrients) – not in high-nutrient conditions like those that occur when there is upwelling. Currents then move the bloom inshore where it can kill fish and cause respiratory irritation for beachgoers because of a neurotoxin inside the K. brevis cells.
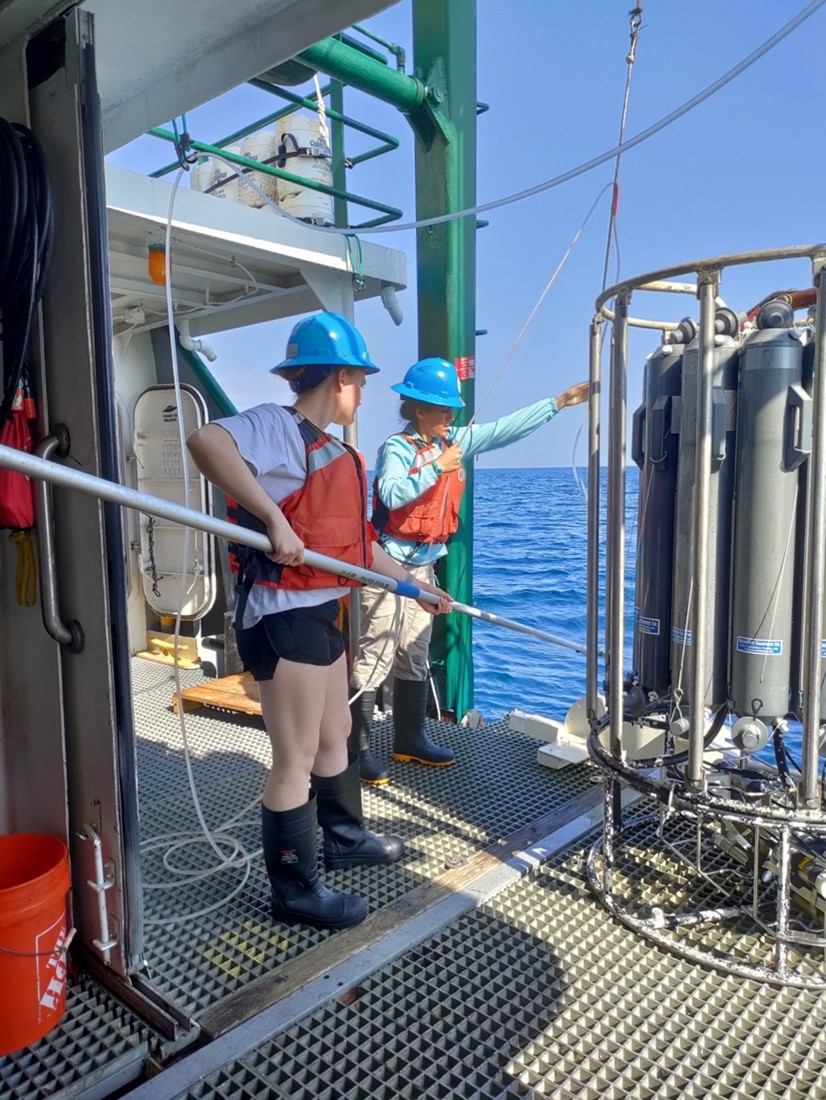
Casey Nickel and Naja Murphy deploy the towfish on the West Florida Shelf. Photo credit, Mia Bradshaw at Eckerd College.
These basics of red tide bloom formation have been refined over several decades of research at the CMS by Weisberg’s lab and others such as long-retired Dr. John Walsh, collaborators at FWRI, and more.
“We’re excited to continue to refine our models using the data collected during this collaborative mission,” said Liu.
Data collected from this mission will benefit all labs -- enhancing their collective understanding of red tides, with an eye toward better predicting them in the future.
“By building a richer data set we have an opportunity to tie things together,” said Buck. “There are a lot of boxes that are unknowns – we aim to fill in those boxes to make models more powerful tools to predict red tides,” said Buck.