By: Dyllan Furness, Science Communication Manager for the Florida Flood Hub for Applied Research and Innovation
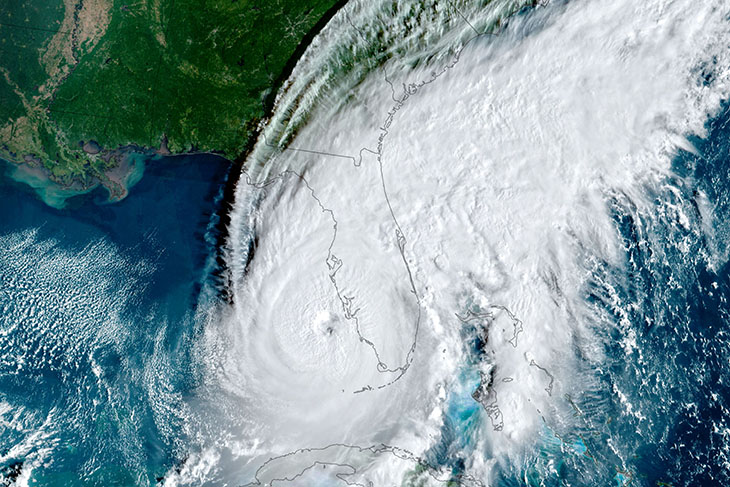
The 2022 Atlantic hurricane season is behind us, but its impact will be felt in Florida for years to come. On September 28, Hurricane Ian made landfall in southwest Florida as a Category 4 storm. Massive storm surge devastated many coastal areas. Further inland, Ian’s historic rains sent rivers over their banks and residents fleeing for higher ground.
In the wake of the hurricane, researchers at the University of South Florida College of Marine Science (CMS) have been hard at work studying the storm’s impacts on the state. From high-resolution modeling to satellite imagery, these snapshots show our teams at work.
Predicting storm surge
Days before Ian made landfall, as many Tampa Bay residents braced for double-digit storm surge, a model developed by the Ocean Circulation Lab at CMS told a different story. Tampa Bay would likely see reverse storm surge, according to the model. Ian could flush feet of water out of the bay.
Days before Ian’s landfall, the Tampa Bay Coastal Ocean Model predicted negative storm surge in Tampa Bay. Courtesy of the Ocean Circulation Lab.
“At first I was surprised by the results,” said Yonggang Liu, a physical oceanographer who is director of the Ocean Circulation Lab after the retirement of the former director, Bob Weisberg. But when the National Hurricane Center updated its forecast on Tuesday, September 27, projecting Ian’s landfall further south between Tampa Bay and Charlotte Harbor, Liu realized the model, Tampa Bay Coastal Ocean Model (TBCOM), called it right. At noon, he shot off an email to share the results with his colleagues.
“Many people emailed back about how relieved they were that we wouldn’t get serious storm surge in Tampa Bay,” Liu said.
“Great news before leaving town,” one person wrote.
Liu followed up Wednesday morning with an update — this time, a more sobering perspective from his lab’s West Florida Coastal Ocean Model (WFCOM), which covers a larger area. Ian’s southward shift meant significant storm surge was coming to communities in Lee and Collier counties. Liu created a short clip using data for WFCOM and a wind force model provided by the National Oceanic and Atmospheric Administration (NOAA) to depict the sea level response.
This visualization of the West Florida Coastal Ocean Model shows dramatic changes in sea level along Florida’s southwest coast. Courtesy of the Ocean Circulation Lab.
Liu worked through sporadic power-outages at his St. Petersburg home to keep the models updated and provide results to partners like NOAA.
TBCOM and WFCOM use current and past data to predict conditions for much of Florida’s west coast. These high-resolution models allow for unique precision in tracking and predicting water velocity, temperature, salinity, density, and sea level.
Forecasts created using both models were confirmed by buoy and tide-gauge data during the storm. To the south of Ian’s eye, tide gauges measured record high water levels, while areas north of the eye, such as Tampa Bay, measured record lows.
"We’ve been maintaining these models for many years,” Liu said. “In terms of coastal implications for our region, you won’t find anything better than these models.”
Views from above and down below
Satellites gave a unique perspective of Ian’s impact. Soon after the storm, images showed a nearshore mosaic along the southwest Florida coast, as tea-colored runoff seeped through Charlotte Harbor and resuspended silt turned large swathes of water a light-blue hue.
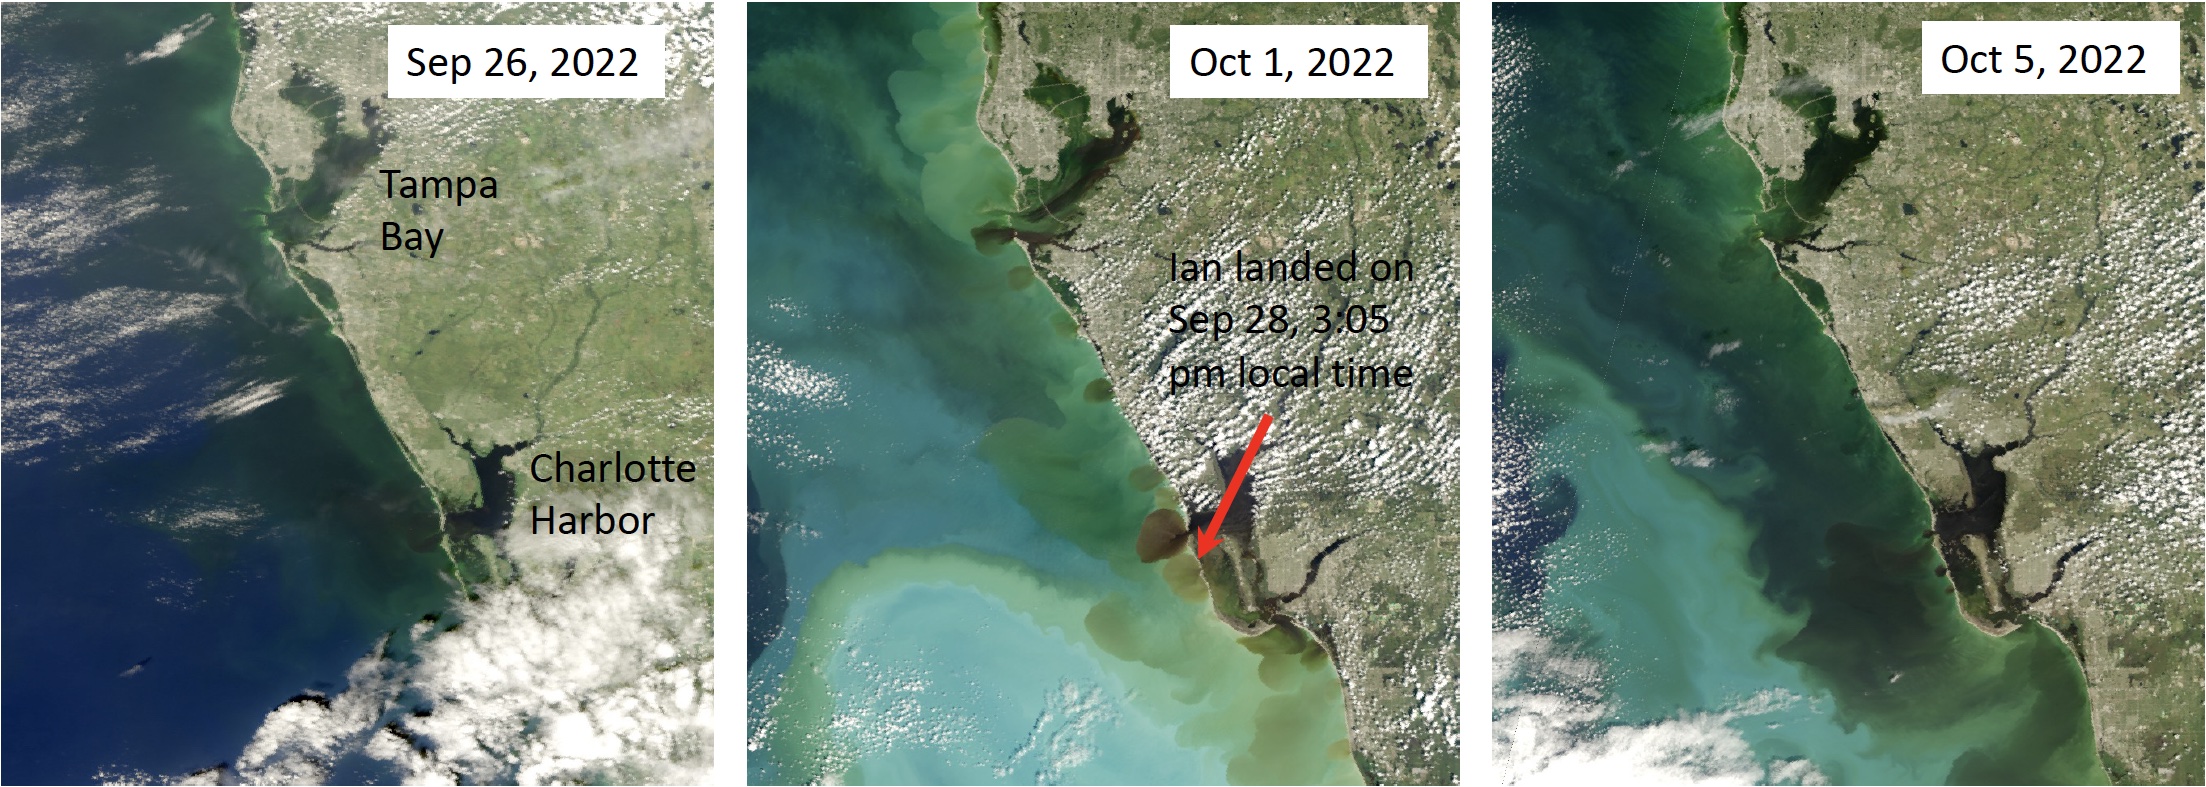
True-color satellite images show resuspended silt and discharge from rivers and estuaries following Ian’s historic inland rainfall. Courtesy of the Optical Oceanography Lab.
True-color images help visualize changes to water composition and point to origins of discharge, said Chuanmin Hu, a CMS professor and director of the Optical Oceanography Lab. But to better determine concentrations of particles beneath the surface, he and his team use false-color images of non-visible wavelengths.
Hu’s images showed high concentrations of chlorophyll-a near the mouth of Charlotte Harbor and Sanibel Island, signaling an algal bloom, and increased turbidity caused by resuspended silt. In most waters of the shallow shelf, water clarity was less than two meters, temporarily impacting the ability to measure changes to the seafloor.
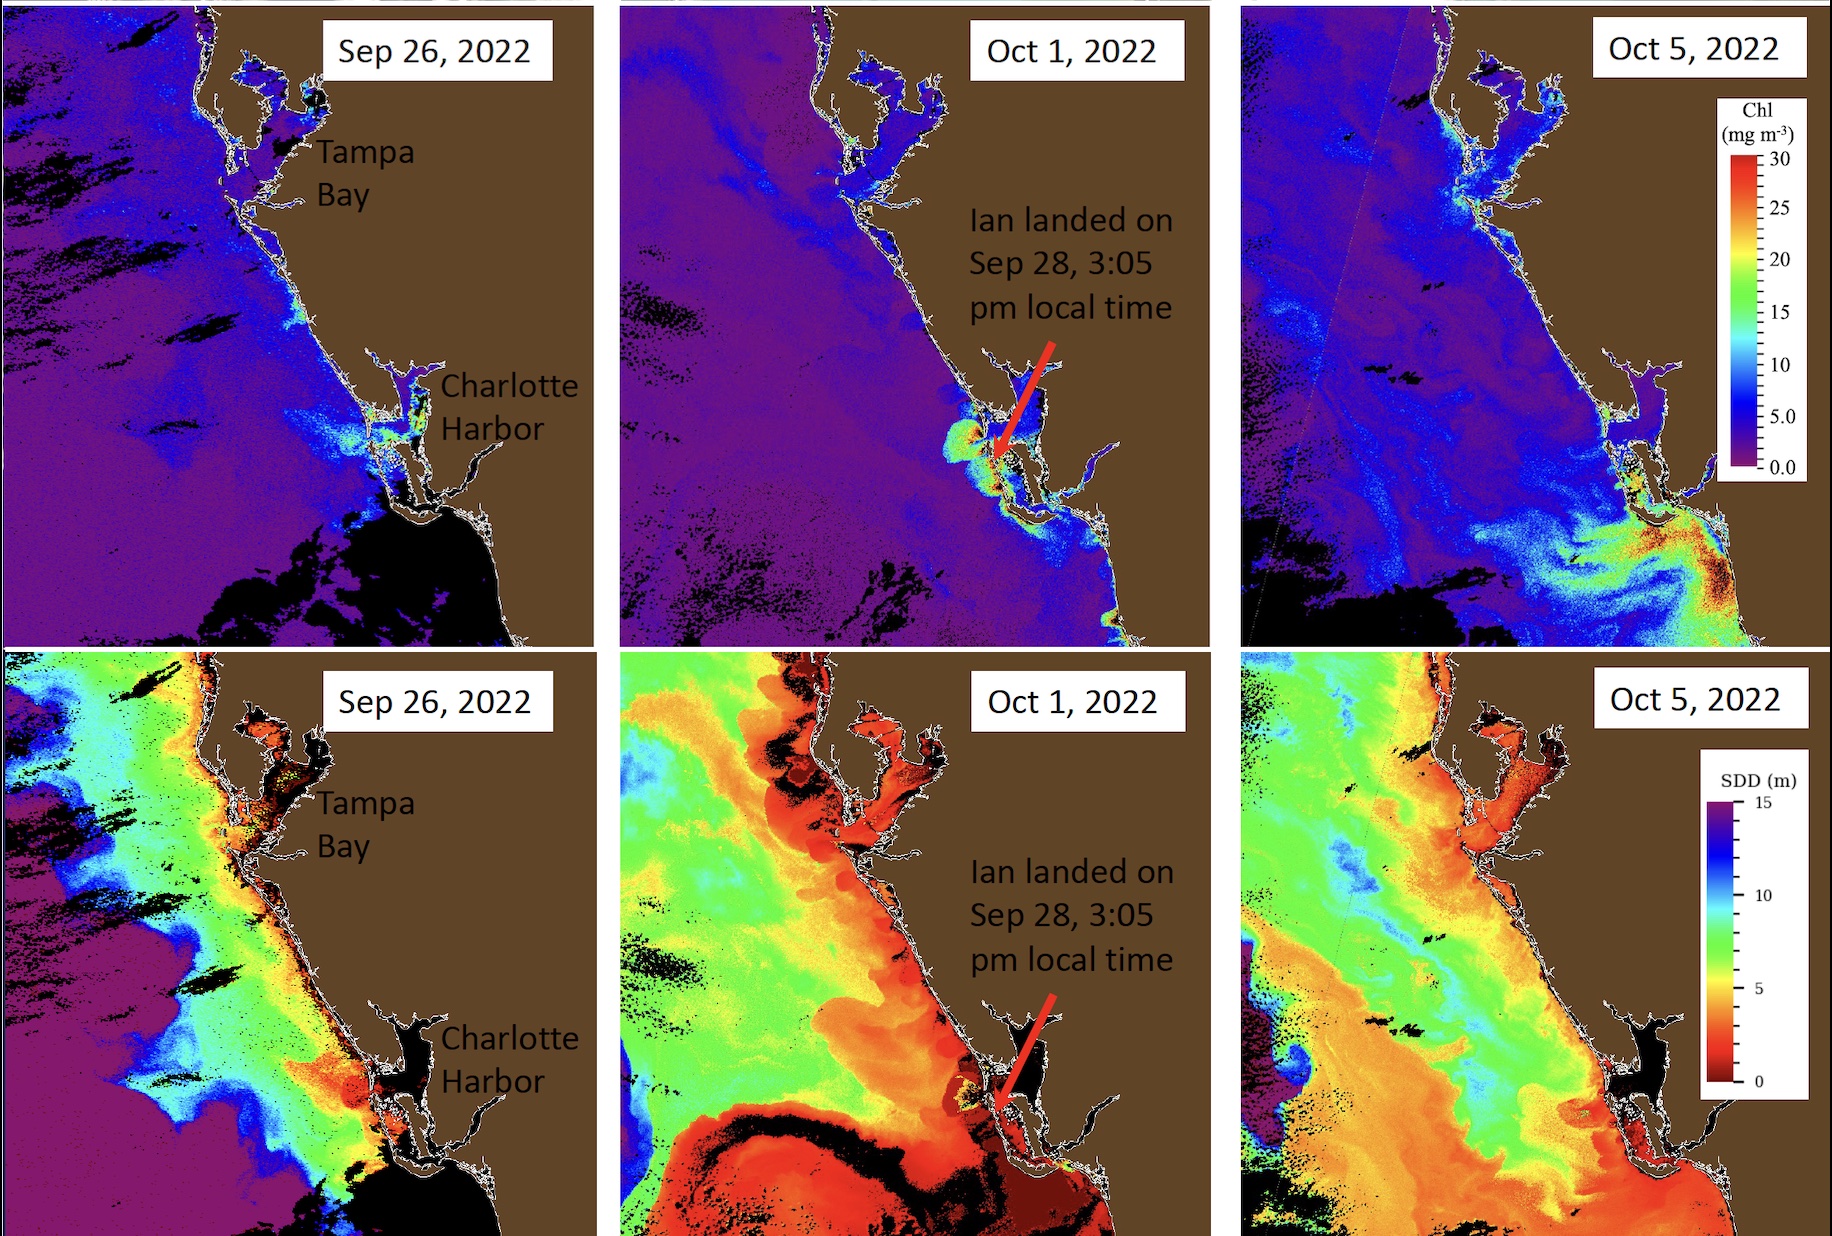
Top: High concentrations of chlorophyll-a (an index for algae) are found mostly near Charlotte Harbor mouth and Sanibel Island on October 1, which further developed to an extensive algae bloom, mostly south of the Sanibel Island, a few days later. Bottom: After Ian’s landfall, water clarity reduced to between two and five meters in some nearshore regions. Courtesy of the Optical Oceanography Lab.
For the Ocean Technology Group (COT), which operates several remote gliders, Hu’s images helped decide where and how to invest resources to study ocean’s response to Ian. In early October, the group launched one of its gliders off the coast of Charlotte Harbor to help validate Hu’s satellite observations with data from beneath the waves.
“Gliders collect data from the surface to the seafloor, allowing for a complete picture of the water column,” said Chad Lembke, a project engineer at COT.
The glider zig-zagged through the Gulf for a little over a month, measuring temperature, salinity, chlorophyll, and more along its path. These data will help researchers study how Ian’s intense winds, massive waves, and immense rainfall shaped the marine environment in southwest Florida.
A serendipitous coastal research cruise
For the past 20 years, the University of Miami’s R/V Walton Smith has conducted interdisciplinary research cruises along Florida’s south and southwest coastlines about every two months. The most recent cruise happened to set sail a week after Ian made landfall. The timing presented a rare opportunity to study the storm’s impacts on the region.
Onboard were USF graduate students Cara Estes and Sebastian DiGeromino who work with professor Frank Muller-Karger, and Naja Murphy who works with professor Kristen Buck. They joined partners from NOAA’s Atlantic Oceanographic and Meteorological Lab (AOML), NASA, and other groups.

Sebastian DiGeromino samples water on the R/V Walton Smith research cruise. Courtesy of Naja Murphy.
“The Walton Smith has a long and rich history of collaboration between all different groups,” said Muller-Karger, a biological oceanographer. “This trip gave us the chance to see how the West Florida Shelf changed after the hurricane, and if there were any impacts on the Florida Keys National Marine Sanctuary.”
The Walton Smith hugged the coastline of the Keys before entering Florida Bay to head north toward Tampa Bay. Along the way, the ship rendezvoused with USF’s glider. By overlapping their routes, USF scientists can map a much larger area and calibrate the drone’s measurements by cross-referencing it with the data collected from the ship.
Graduate student Murphy sampled water for dissolved iron, a nutrient needed by algae. Students Estes and DiGeromino alternated 12-hour shifts sampling and filtering water to test for various organic compounds.

Sunset from the deck of the R/V Walton Smith. Courtesy of Sebastian DiGeromino.
Much of the water they sampled had been flushed from rivers through estuaries — a product of the massive rains Ian dumped inland. Rivers carried loads of organic matter that rotted once it reached the sea, emitting a strong smell of decay. Through further research, they hope to be able to determine the types of material in the water they sampled in the Gulf and its impact of marine life.
DiGeronimo even took advantage of the trip’s fortuitous timing by collecting samples for a colleague at the University of Florida who couldn’t join the cruise.
The significance wasn’t lost on Estes either. “I like to think that the work we did will help other scientists study storm impacts in the future,” she said.
Bringing buoys back online
Ian didn’t go easy on weather buoys. Two of the four buoys operated by CMS were effectively offline following the storm.
“They’re still sending transmissions, so the power system is OK, but their transmissions are just garbled,” said Jay Law, a research scientist and mooring technician in the Ocean Circulation Lab at CMS. He suspects damaged antennae are to blame.
To get a sense of Ian’s strength, consider this: each buoy is moored to the seafloor by roughly 5,000 pounds of anchor and chain. And yet, the storm’s waves dragged one buoy nearly 10 miles.
“We’ve never seen anything like that,” said Law, who’s spent two decades working with buoys.

Jay Law, left, and crew with a weather buoy on the deck of the R/V Weatherbird II. Courtesy of the Ocean Circulation Lab.
Weather buoys play an integral role in gathering data and validating models by comparing the models’ projections to the real-world data from the field. Data collected by these buoys include current speed and direction; wind speed; sea level; air temperature; and sea surface temperature.
“Buoys have been critical to evaluating models and improving their accuracy,” Law said. High-resolution models like TBCOM and WFCOM rely on buoy data to improve their accuracy. “Our field observations have shown these models do a good job of predicting conditions.”
Since the storm, Law and his team have been busy building new buoys on the CMS seawall before testing them in the harbor and hauling them out to sea.
“Our group has had a lot of success in leveraging our engineering assets and technical personnel assets,” Law said. In other words, “we’re good at getting equipment in the water and making sure they work like they’re supposed to.”