Foraminifers as Bioindicators
Methods
A variety of sample collection procedures has been successfully used by numerous researchers who have assessed foraminiferal assemblages in surface sediments. For example, samples can be collected by SCUBA divers using a scoop and plastic bags (e.g., Donnelly, 1993) or small pushcores (e.g., Cockey et al., 1996; Ishman, 2000). When grab samples or box cores are routinely taken for invertebrates and/or sediment analyses in larger monitoring efforts (e.g., McRae et al., 1998; Engle, 2000), a small surface subsample for foraminiferal analysis can simply be processed separately.
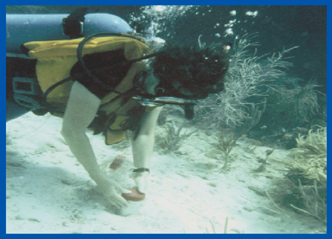
Surface samples being collected directly by SCUBA.
Samples or reports of analysis of samples collected 30 or more years ago are seldom available for sites of concern. Thus, collection and analysis of sediment cores provide the best hope for historical records of impacted benthic communities. The following describes some methods for sample processing, which can be used for core samples as well as surface samples. The ideal sample size is 10 grams dry weight, which is a volume of approximately 10-20 cm 3. A sample of this size can be split in half, with one half saved as backup or archived. More sample will be required if constituent analysis (requires a minimum of 15 cm 3) and dating will be done. Otherwise, the remaining half is divided into an approximately 1-gm portion and a 4-gm portion. The 4-gm portion is used for routine sediment grain-size analysis (Folk, 1974). If such analysis is being performed as part of the larger monitoring effort, then it need not be repeated on the foraminiferal sample.
Grain-size Analysis
Using tap water, wet sieve approximately 4 gms of sediment through a 63-µm sieve to break up clumps and separate the mud- and clay-size portions from the rest of the sample. If percent carbon is to be analyzed, wet sieving should be done with buffered, deionized water. Sodium metaphosphate (NaPOx concentration 180 mg/l) can be used as the buffer. Weigh empty beakers prior to wet sieving so the weights of the <63-µm particles and the rest of the sample can be determined after drying at 40-50 oC in an oven. The part of the sample > 63 µm should be weighed and then dry sieved for 15 minutes on an electric shaker to determine the following size fractions: >2 mm, 1-2 mm, 0.500-1 mm, 0.250-0.500 mm, 0.125-0.250 mm, 0.0625-0.125 mm, and < 0.063 mm (pan). Record the weights before sieving and weights of each sieve catch. Combine the weight of the pan fraction with the mud removed by wet sieving to determine the total mud fraction. Grain-size analysis is not required to calculate the FORAM Index. However, it is useful to determine if FORAM Index values are influenced by grain size, as well as for additional data analyses.
Enumeration of Foraminferal Taxa
The 1-g portion of the sample should washed with fresh water over a 63-µm mesh sieve to remove mud-size sediments, then dried on filter paper at 40-50 oC until the sample is thoroughly dry. The dried sample should be disaggregated if necessary, thoroughly mixed, and poured into a mound on a clean, smooth surface. With a fine spatula, a small scoop of the sample (approximately 0.01 gm) is removed from the center of the mound and weighed to the nearest milligram. The weighed subsample is sprinkled over a gridded picking tray and examined using a stereomicroscope. All foraminifers in readily identifiable condition (i.e., heavily worn and reworked specimens are excluded) are picked onto a cardboard micropaleontological slide, and a preliminary count is made. If the number of specimens picked is approximately 150-200, the subsample is sufficient. If fewer specimens were picked in the first portion, then a second portion is removed from the mound, weighed, and picked. This process can be repeated until a picked assemblage of 150-200 specimens is obtained or until the entire gram of sample is picked.
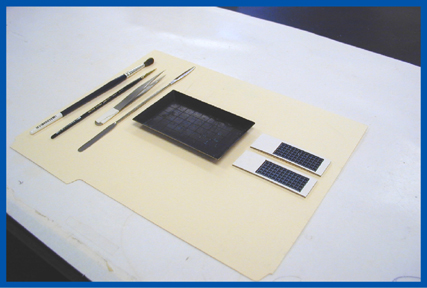
Standard foraminiferal analysis tools include artist's paint brushes, forceps, spatula, gridded picking tray, and gridded cardboard micropaleontological slides.
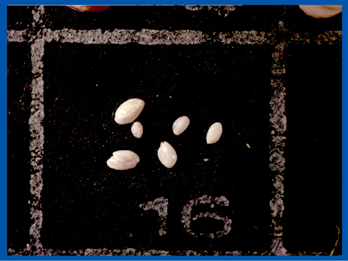
Close up of a micropaleontological slide.
Data Analysis: Calculating the FORAM Index
Step 1. Pick all foraminifers from a subsample of sediment onto a cardboard micropaleontological slide, obtaining ideally 150-200 specimens.
Step 2. Sort all specimens by genus, count, and record in a spreadsheet, with genera arranged by functional group. Genus level data can be further analyzed using multivariate statistical methods.
Step 3. Calculate the proportion (P) of specimens for each functional group by summing the specimens of each genus of that group (N) and dividing by the total number of specimens counted (T).
- Ps = Ns/ T, where subscript "s" represents symbiont-bearing foraminifers
- Po = No/T, where subscript "o" represents opportunistic foraminifers
- Ph = Nh/T, where subscript "h" represents other small, heterotrophic foraminifers
Step 4. Weight proportions to calculate the FORAM Index (FI):
FI = (10 x Ps) + (Po) + (2 x Ph)
Step 5. Interpretation:
- FI greater than 4 indicates local environment conducive to reef growth (or recovery if reef communities have been damaged)
- FI highly variable among samples, varying between 3 and 5-6, indicates early stages of environmental decline
- FI greater than 2 but less than 4 indicates local environment marginal for reef growth and unsuitable for recovery
- FI less than 2 indicates conditions unsuitable for reef growth
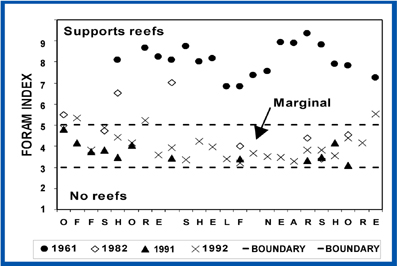
Spatial and temporal variability, and interdecadal changes in the FORAM Index for samples from traverses off Key Largo, Florida. The FORAM Index reflects the decline of Florida reefs over the past 4 decades.
References
Cockey, E. M., Hallock, P. M., and Lidz, B. H., 1996, Decadal-scale changes in benthic foraminiferal assemblages off Key Largo, Florida. Coral Reefs, v. 15, p. 237-248.
Donnelly, K.B. 1993. Characterization of the Foraminiferal Assemblage Off the Southwest Coast of Puerto Rico at La Parguera, M. Sc. Thesis, University of South Florida, Tampa, Florida, pp. 1-272.
Engle, V.D.: 2000, Chapter Three: Application of the indicator evaluation guidelines to an Index of Benthic Condition for Gulf of Mexico estuaries, In Jackson, L.E., Kurtz, J.C., and Fisher, W.S. (ed.), Evaluation Guidelines for Ecological Indicators, EPA/620/R-99/005. U.S. Environmental Protection Agency, Research Triangle Park, NC, pp. 3-1 - 3-29.
Folk, R.L.: 1974, Petrology of Sedimentary Rocks, Hemphill, Austin, TX, pp. 1-159.
Hallock, P.(In press). Foraminifera as bioindicators in coral reef assessment and monitoring: the FORAM Index. Environmental Assessment and Monitoring.
Ishman, S. E., 2000, Benthic foraminifera distributions in South Florida, in Environmental Micropaleontology. Kluwer Academic Press, p. 371-383.
McRae, G., Camp, D.K., Lyons, W.G. and Dix, T.L.: 1998, Relating benthic infaunal community structure to environmental variables in estuaries using nonmetric multidimensional scaling and similarity analysis, Environmental Monitoring and Assessment 51, 233-246.
Introduction | Methods | References: taxonomy and ecology | References: polluted and other stressed environments