Overview
Sample Missions
Red Tides
A species of toxic dinoflagellate called Karenia brevis is responsible for most of the harmful algal blooms (HABs, commonly called red tides) in the Eastern Gulf of Mexico (GOM). K. brevis red tides occur near annually and can cause fish and marine mammal kills and other environmental problems. Our glider operations in the Gulf of Mexico have greatly improved the understanding of the evolution of red tides. Since 2010 we have programmed our gliders to collect three-dimensional information on bloom initiation and formation along with unprecedented data that scientists use to validate numerical models and satellite observations. We collect water column data such as temperature, salinity, fluorescence, oxygen, and the presence or absence of fish. These data help researchers improve their understanding of red tide bloom dynamics, such as where blooms start, where they will go, and how long they are likely to persist.
View Red Tide Forensics: So THAT’s What Happened
View Application of New Technology to the Monitoring and Prediction of Florida Red Tides
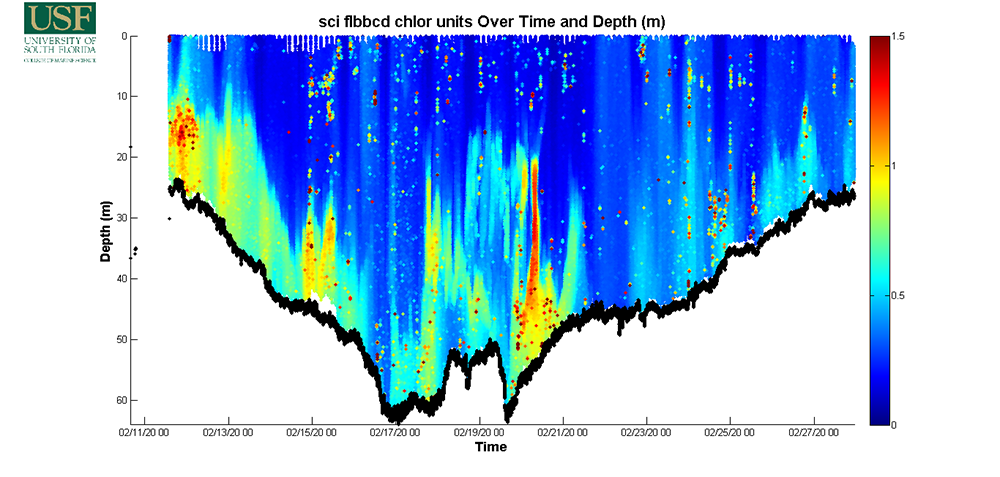
Chlorophyll fluorescence highlighting near bottom blooms indicative of red tide related conditions.
Weather and Hurricane Forecasting
Scientists have understood for decades that warm surface ocean water fuels hurricanes. In recent years they have also realized that water beneath the surface (water “at depth”) is also important to understand. Knowing the temperature of the deeper water can help scientists better predict hurricane formation: the warmer the water and the deeper it goes, the more fuel there is for the storms to strengthen. The glider team routinely sends its gliders on missions to capture this kind of temperature profile data off the Southeastern coast from Florida to North Carolina, as well as in the eastern Gulf of Mexico. This helps NOAA hurricane forecasters better understand whether a storm will increase in strength.
View Squalls Out on the Gulf Stream
View A New, Fast Way to Analyze Hurricane Damage to Coastal Environments
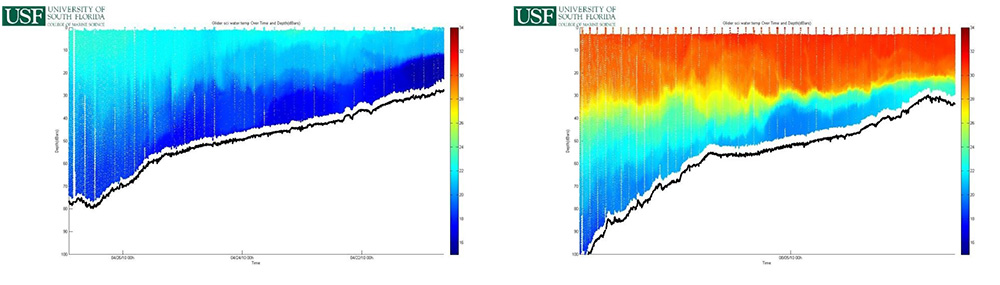
Temperature profiles in the eastern Gulf of Mexico demonstrating the differences in heat content and therefore the fuel that can be provided to a passing storm, allowing it to strengthen. The two figures are from missions in late April (left) and early August (right) of 2010.
Oil Spill Response
In the aftermath of the historic Deepwater Horizon oil spill (2010), the USF glider team worked with several other organizations to demonstrate the utility of autonomous gliders in monitoring the water property structure to help track sub-surface oil plumes. On the West Florida Shelf, the University of South Florida, Mote Marine Laboratories, Rutgers University, and the University of Delaware performed at least 14 deployments. All data from these deployments were displayed real time via the Rutgers University Coastal Ocean Observation Lab website.
USF’s glider deployments focused on the shelf region from Tampa Bay north to the Big Bend region. Glider data showed that the West Florida Shelf was in a state of upwelling following the oil spill, indicating that deep offshore water was moving along the bottom toward the coast. This kind of deployment is critical in understanding the possibilities of subsurface oil migrating into coastal waters through important bottom fish habitat.
View Oil Toxins Pervasive in Gulf of Mexico
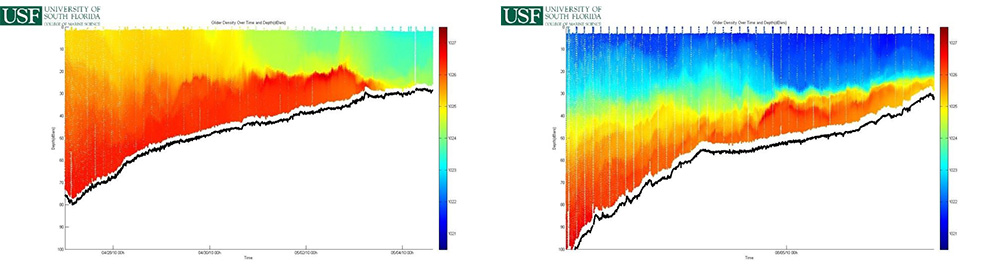
Density profiles showing water mass changes of a Tampa Bay transect during April (left) and August (right) 2010.
Fish Monitoring
Passive acoustic monitoring (PAM) is a noninvasive way to monitor animals that produce sound over long periods of time. Soniferous fish (fish that make sounds), such as commercially and recreationally important red grouper, use sound for communication involved in courtship, spawning, parental behaviors, territorial, or aggressive behaviors. PAM data is collected using a hydrophone-integrated autonomous glider that may help scientists identify fish species, distribution and behavior. Gliders additionally equipped with optical and environmental sensors record data about the oceanographic conditions in areas where fish are found, including anthropogenic sounds such as boat noise sometimes associated with fishing pressures.
View Florida’s most valuable treasure map?
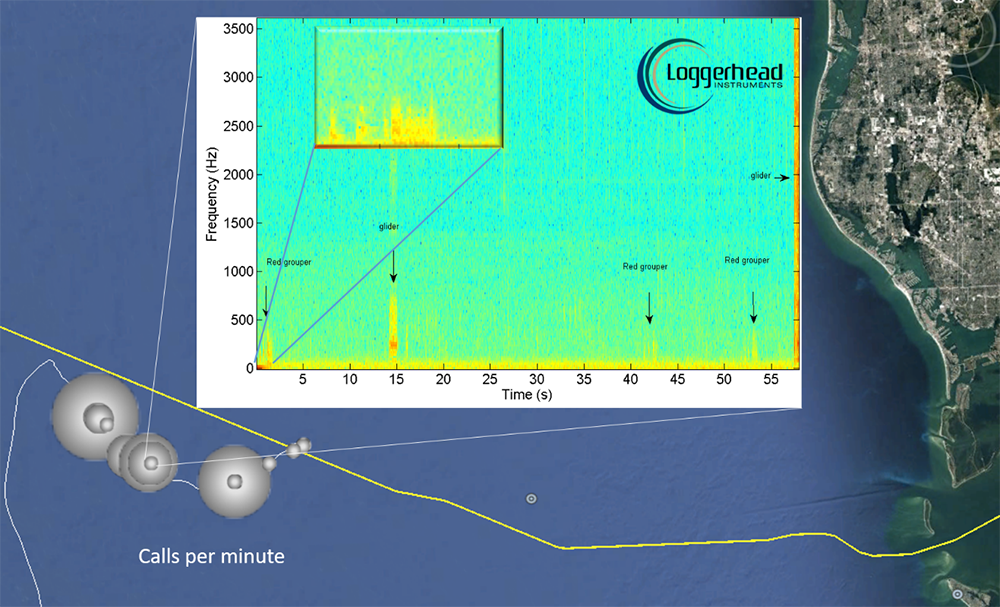
Map and spectrogram of red grouper sounds collected via a glider near the Gulfstream natural gas pipeline on the West Florida Shelf.
Assessing water column biomass using echosounders
Our gliders also use an active acoustics instrument called an echosounder to look for fish and other organisms of interest in the water column. Active acoustics refers to acoustic technologies that emit their own sound energy as a pulse or “ping” (from a transducer) that travels through the water column and reflects off of organisms and objects that scatter the sound in return (such as fish and the seafloor). The glider’s transducer receives the reflected sound energy (called backscatter), which then translates it into a picture or echogram. These help scientists depict where fish are swimming in the water column and also help to identify other hard surfaces, such as the seafloor.
In addition, the echogram is typically color-coded to indicate the strength of the
reflected energy. For example, a school of fish will reflect more energy than an individual
fish. By placing certain threshold criteria on the backscatter strength and using
specialized software like Echoview, fisheries acousticians can determine what returns
or "signatures" are likely for different species of fish. Characterizations of these
concentrations can range from broad plots of reflected energy that can be used as
a proxy for biomass, to more specific fish density and abundance estimates.
View Researchers deploy new tech to explore depths of Gulf of Mexico
View USF CMS Research Team Working as Part of the Cooperative Red Snapper Count
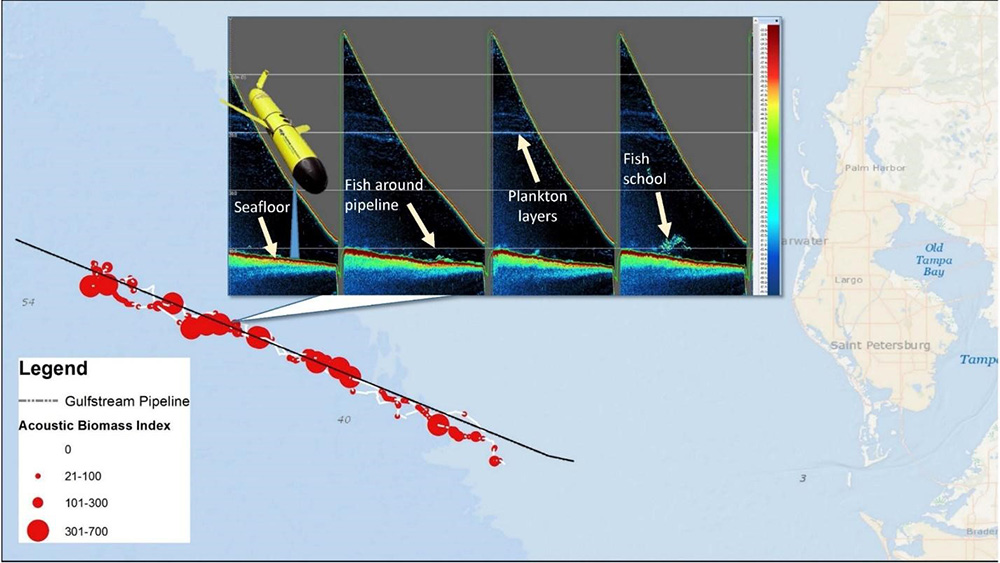
Echosounder data from a glider showing biomass on Gulfstream natural gas pipeline on West Florida Shelf.
Tag telemetry
Acoustic tagging of fish and marine mammals has been a growing method for understanding their behaviors. A small acoustic tag is safely implanted into an animal. The tag periodically sends out a “ping” that can be heard by a receiver located within several hundred meters. Gliders can be equipped with these receivers to detect the acoustic pulses and help scientists identify which fish is heard, where they are found, and even some environmental parameters of the surrounding water. An added benefit of using gliders for this purpose is that additional water quality variables related to oxygen levels, temperatures, currents, potential for red tide, and even bottom relief can provide better understanding of why fish may choose one location over another. Using gliders as “exploratory sentinels” compliments the more traditional practice of utilizing moored receivers.

Glider with a VEMCO Mobile Transceiver attached externally for tag detection.